---
title: "Register a Data Aggregate"
description: "Register a Data Aggregate, a Data Element whose value is computed across multiple rows, for use in Features, Models, and Policies."
---

import { Tabs, TabItem } from '@astrojs/starlight/components';

<div style="padding: 14px 16px; border: 0.5px solid #AFA9EC; border-radius: 12px; background: #EEEDFE; margin-bottom: 1.5rem;">
  <div style="display: flex; align-items: center; gap: 7px; margin-bottom: 8px;">
    <svg width="16" height="16" viewBox="0 0 16 16" fill="none">
      <path d="M9 2L4 9h4l-1 5 5-7H8l1-5z" stroke="#7f77dd" stroke-width="1.2" stroke-linecap="round" stroke-linejoin="round"/>
    </svg>
    <span style="font-size: 11px; font-weight: 500; letter-spacing: 0.05em; text-transform: uppercase; color: #534AB7;">TL;DR</span>
  </div>
  <div style="font-size: 13px; color: #3C3489; line-height: 1.65;">
    Compute a value across multiple rows (like "max DPD in the last 6 months") and register it as an <strong>Aggregated</strong> Data Element. Tick <strong>Is Aggregated</strong> on the Data Element form, point at one or more source tables, and write the aggregation in Python, Pandas, or Spark.
  </div>
</div>

## What is it?

An **Aggregated Data Element** is one whose value is computed across multiple rows rather than read from a single column. Use it when the value you need has to be calculated across records, for example counting an account's transactions, taking the max DPD over the last 6 months, or rolling Account rows up to a Customer.

<table class="de-compare">
  <thead>
    <tr>
      <th style="width: 20%;"></th>
      <th>Simple Data Element</th>
      <th>Data Aggregate (this page)</th>
    </tr>
  </thead>
  <tbody>
    <tr>
      <td class="axis-cell">Maps from</td>
      <td>A single column</td>
      <td>Multiple rows across one or more tables</td>
    </tr>
    <tr>
      <td class="axis-cell">Use when</td>
      <td>The column value is ready to use as-is</td>
      <td>You need to compute something across records</td>
    </tr>
    <tr>
      <td class="axis-cell">Example</td>
      <td><code>annual_income</code> from <code>app_table</code></td>
      <td>Max DPD in the last 6 months: the highest <code>days_past_due</code> across the last 6 rows in <code>account_performance</code></td>
    </tr>
  </tbody>
</table>

## How to Register

Follow these steps to register a Data Aggregate.

<details open class="step">
<summary>

#### Open the Create Form

</summary>

On the **Data Vault → Data Element** page, click **+ New Data Element**.

A name prompt opens first. Enter a descriptive name for the Data Element (for example, `Total Deposit Amount (Last 90D)`) and confirm to land on the full Data Element form.

</details>

<details open class="step">
<summary>

#### Fill in Attributes

</summary>

Set the **Data Type** <span style="color: #E5484D;">*</span> - the **output type of your aggregation** (for example, `numerical` for a count or sum, `boolean` for a flag).

Fill in the **Alias** and **Entity**. See [Common Registration Info](/user-guide/how-tos/common-registration-info/).

Tick **Is Aggregated**. This switches the Definition section into aggregation mode, revealing an Input Type editor in place of the Source Column dropdown.

:::note[Picking the right Data Type]
The **Data Type** must match what your code returns:

- Counting rows or summing amounts → `Numerical`
- Returning a list of values → `Array Numerical` (or `Array String`, etc.)
- Returning a flag or category label → `String` or `Boolean`

The platform validates the return value against this type when you save.
:::

</details>

<details open class="step">
<summary>

#### Fill in Definition

</summary>

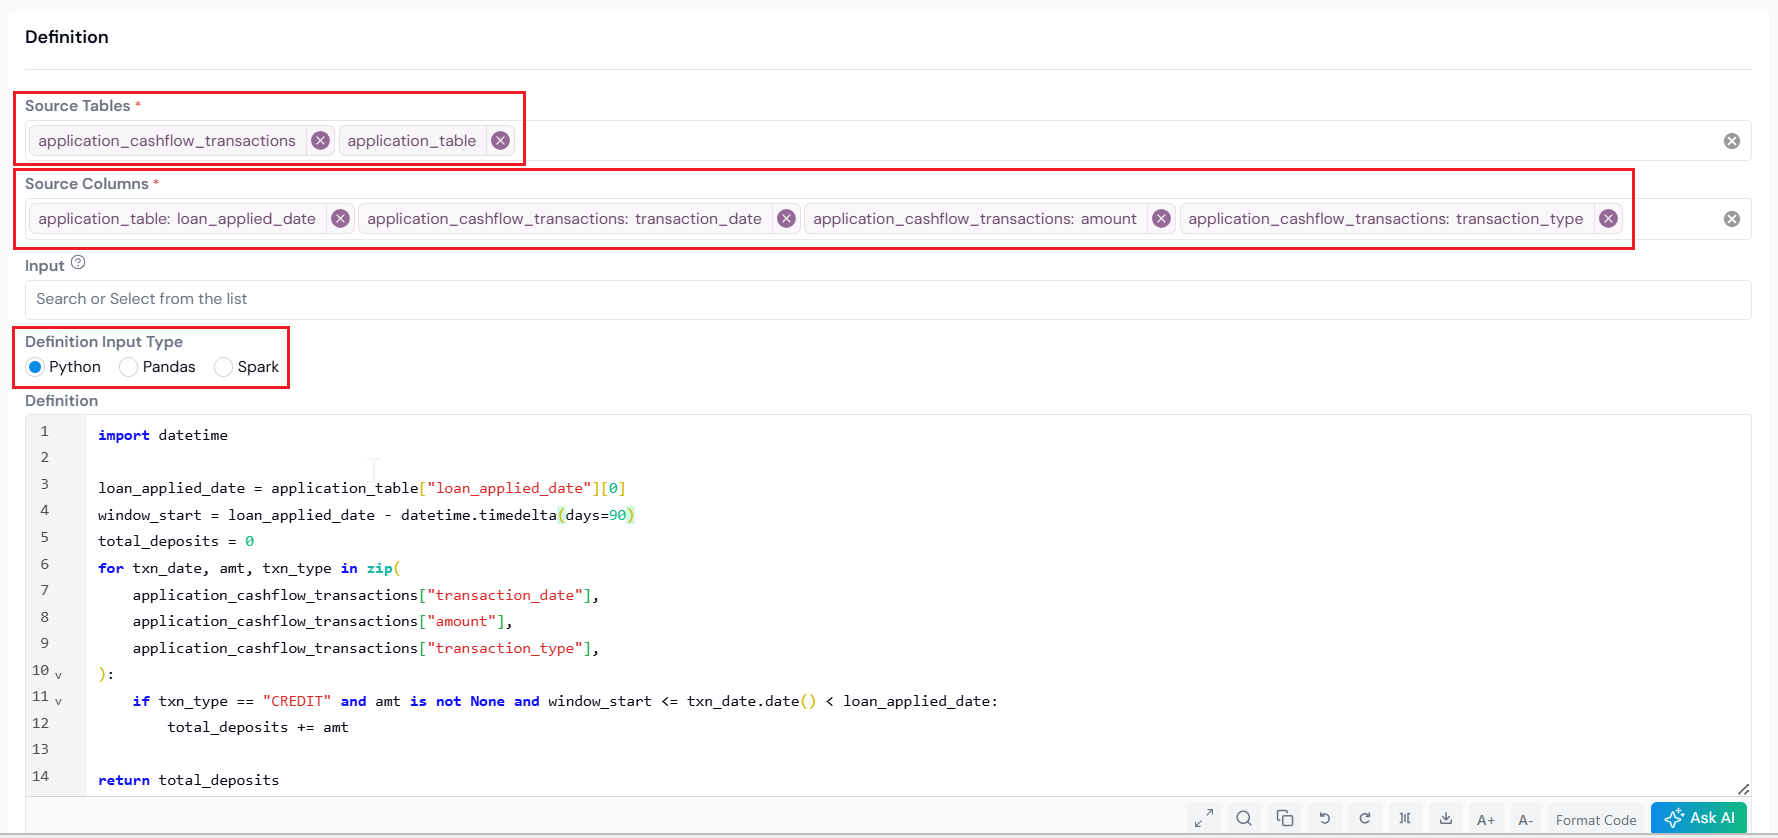
- **Source Tables** <span style="color: #E5484D;">*</span> - one or more tables linked to the entity. Each chosen table becomes a variable in the editor: a table aliased `account` is referenced as `account` in code.
- **Source Columns** <span style="color: #E5484D;">*</span> - the specific columns from those tables that your aggregation reads. Each one is exposed inside the corresponding table variable.
- **Input** - any reusable global function registered on the platform that the aggregation should call.
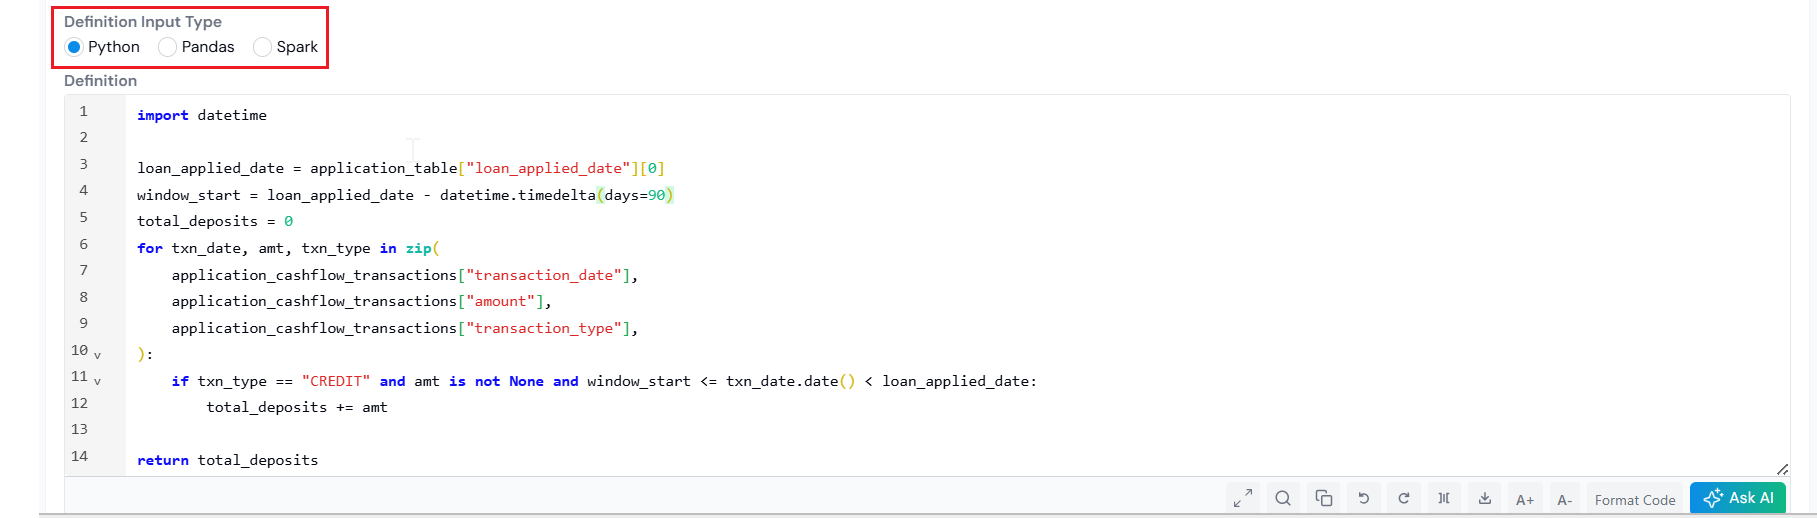
- **Input Type** - pick the language used for the aggregation (Python, Pandas, or Spark), then write the logic in the editor below.
<figure>
  <img src="/images/how-tos/register-a-data-aggregate/register-a-data-aggregate-03-definition.png" alt="Definition section for an aggregated Data Element showing Source Tables, Source Columns, and the Definition Input Type selector." class="screenshot" loading="lazy" />
  <figcaption>Source Tables and Source Columns feed the aggregation; the Input Type selector picks the language.</figcaption>
</figure>

#### How the platform groups your data

When you set **Entity** to Customer, and pick `account` (an Account-level table) as the source, Account rolls up to Customer. The platform groups Account rows by Customer before handing them to your code. **Python** and **Pandas** receive the data already filtered to one customer's rows, so you write logic for a single entity. **Spark** receives the full source table and you must do the `groupBy('customer_id')` yourself, returning a DataFrame keyed by the entity.

Pick the input language that fits how you want to work with the data:

<div class="lang-tabs">
<Tabs>
  <TabItem label="Python">

<figure>
  <img src="/images/how-tos/register-a-data-aggregate/register-a-data-aggregate-04-python-definition.png" alt="Definition editor with Python selected as the Definition Input Type." class="screenshot" loading="lazy" />
  <figcaption>Python Input Type exposes each table as a dictionary of lists, already filtered to the current entity.</figcaption>
</figure>

When you select **Python** as the Input Type, each source table is exposed as a **dictionary of lists**, sliced to the rows belonging to the current entity. Each column lookup returns a Python list. You can import standard libraries (`numpy`, `math`, `datetime`, etc.) inside the editor.

**Example 1: Total number of accounts for customer**

*Inputs:*

- **Source Tables**: `account`
- **Source Columns**: `account_id`

Only `account_id` is selected, so that is the only key available inside `account`. The platform hands your code a dictionary that looks like this:

```python
account = {
    'account_id': [101, 102, 103],
}
```

Then your aggregation runs on top of it:

```python
# `account` is a data dictionary
return len(set(account['account_id']))
```

**Example 2: Default in the next 12 months of application**

*Inputs:*

- **Source Tables**: `account`, `account_performance`
- **Source Columns**: `account.account_application_date`, `account_performance.record_date`, `account_performance.charge_off_amount`

Each table is its own dictionary, with one key per selected column. The platform hands your code the data sliced to one application's rows:

```python
account = {
    'account_application_date': ['2024-01-15'],
}
account_performance = {
    'record_date':        ['2024-04-01', '2024-08-15', '2025-03-01'],
    'charge_off_amount':  [None,         500,           None],
}
```

Then your aggregation runs on top of it:

<div class="collapse-code">

```python
import datetime

# sum charge_off_amount for records within 1 year of `account_application_date`
application_date = account['account_application_date'][0]
total_charge_off_amount = 0
for date, co_amt in zip(
    account_performance['record_date'],
    account_performance['charge_off_amount'],
):
    if (
        date >= application_date
        and date - application_date < datetime.timedelta(days=365)
        and co_amt
    ):
        total_charge_off_amount += co_amt

# default flag if total_charge_off_amount > 0
if not total_charge_off_amount:
    return 0
elif total_charge_off_amount > 0:
    return 1
else:
    return 0
```

</div>

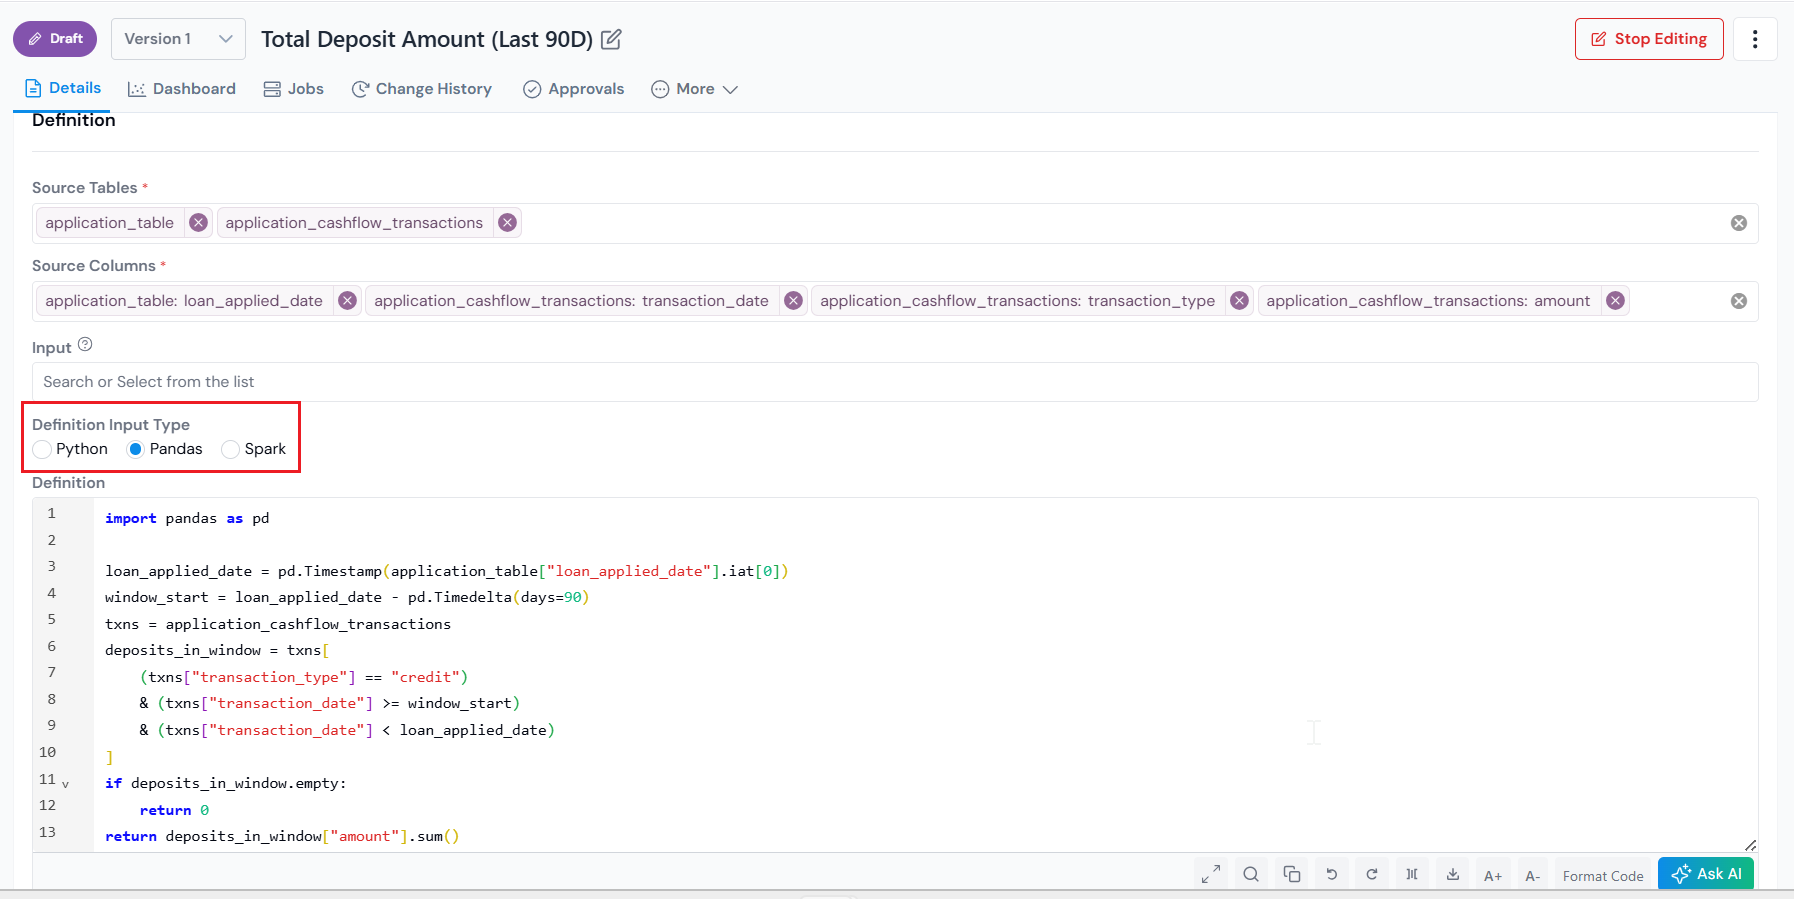
**Example 3: Total deposit amount in the 90 days before application**

*Inputs:*

- **Source Tables**: `application_table`, `application_cashflow_transactions`
- **Source Columns**: `application_table.loan_applied_date`, `application_cashflow_transactions.transaction_date`, `.amount`, `.transaction_type`

The Entity here is Application, so both dictionaries are sliced to one application's rows. The platform hands your code the data like this:

```python
application_table = {
    'loan_applied_date': ['2025-04-01'],
}
application_cashflow_transactions = {
    'transaction_date':  ['2025-01-15', '2025-02-20', '2025-03-10'],
    'amount':            [200,          500,          300],
    'transaction_type':  ['CREDIT',     'DEBIT',      'CREDIT'],
}
```

Then your aggregation runs on top of it:

<div class="collapse-code">

```python
import datetime

loan_applied_date = application_table["loan_applied_date"][0]
window_start = loan_applied_date - datetime.timedelta(days=90)
total_deposits = 0
for txn_date, amt, txn_type in zip(
    application_cashflow_transactions["transaction_date"],
    application_cashflow_transactions["amount"],
    application_cashflow_transactions["transaction_type"],
):
    if (
        txn_type == "CREDIT"
        and amt is not None
        and window_start <= txn_date.date() < loan_applied_date
    ):
        total_deposits += amt

return total_deposits
```
</div>

  </TabItem>
  <TabItem label="Pandas">

<figure>
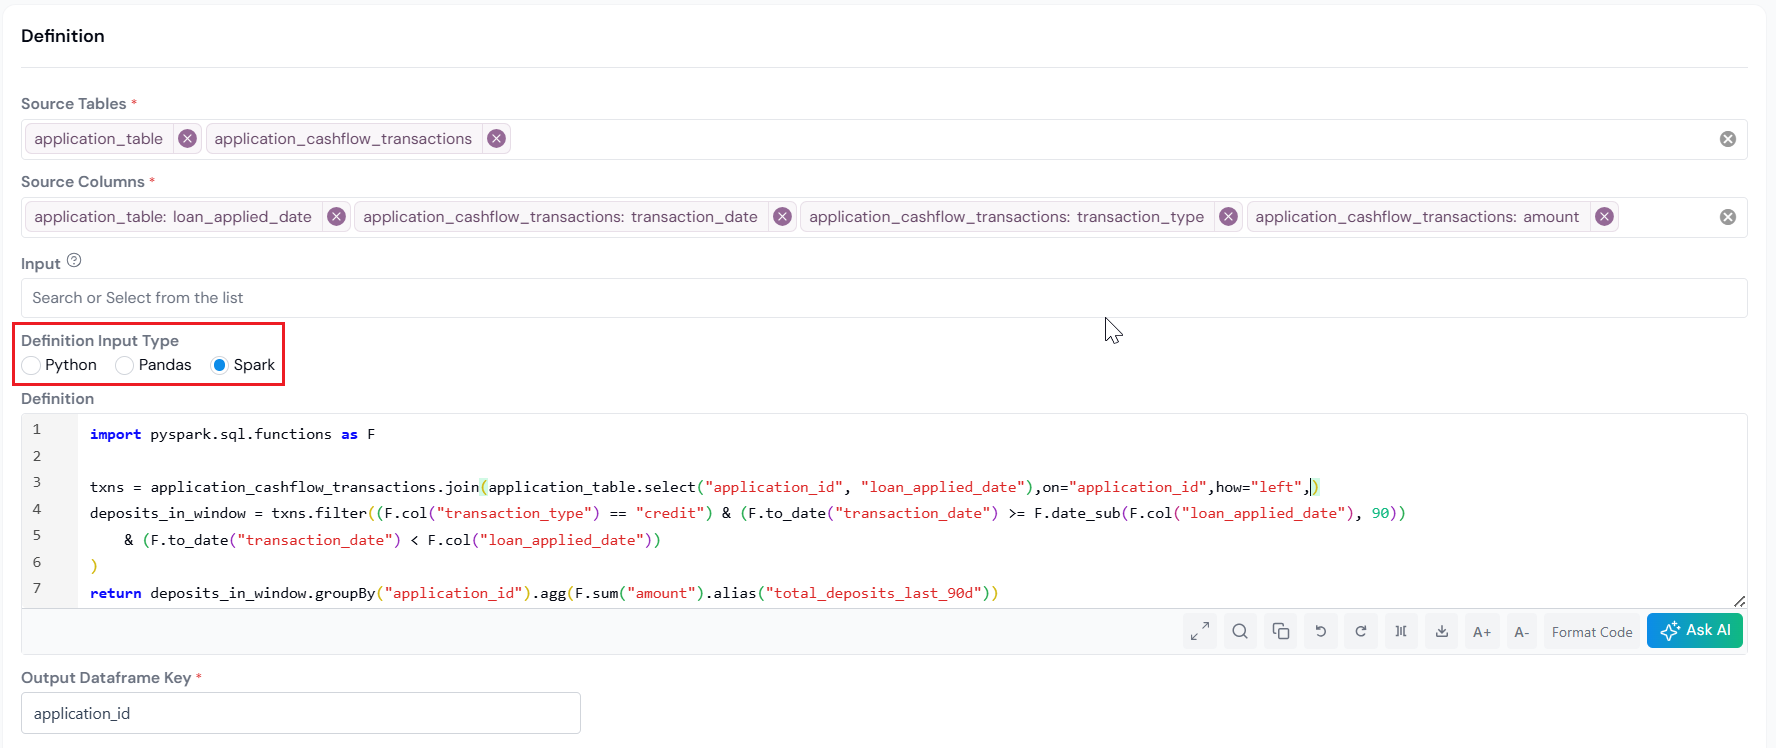
  <img src="/images/how-tos/register-a-data-aggregate/register-a-data-aggregate-05-pandas-definition.png" alt="Definition editor with Pandas selected, showing a 90-day deposit aggregation written as a pandas DataFrame." class="screenshot" loading="lazy" />
  <figcaption>Pandas Input Type exposes each table as a DataFrame, already filtered to the current entity.</figcaption>
</figure>

When you select **Pandas** as the Input Type, each source table is exposed as a **pandas DataFrame**, sliced to the rows belonging to the current entity.

**Example 1: Total number of accounts for customer**

*Inputs:*

- **Source Tables**: `account`
- **Source Columns**: `account_id`

Only `account_id` is selected, so `account` is a single-column DataFrame. The platform hands your code a DataFrame that looks like this:

```text
# `account`:
#    account_id
# 0         101
# 1         102
# 2         103
```

Then your aggregation runs on top of it:

```python
# `account` is a pandas DataFrame
return account['account_id'].nunique()
```

**Example 2: Default in the next 12 months of application**

*Inputs:*

- **Source Tables**: `account`, `account_performance`
- **Source Columns**: `account.account_application_date`, `account_performance.record_date`, `account_performance.charge_off_amount`

Each table becomes its own DataFrame, holding only the selected columns and only the rows for the current customer. The platform hands your code DataFrames that look like this:

```text
# `account`:
#    account_application_date
# 0               2024-01-15

# `account_performance`:
#    record_date  charge_off_amount
# 0   2024-04-01                NaN
# 1   2024-08-15              500.0
# 2   2025-03-01                NaN
```

Then your aggregation runs on top of it:

<div class="collapse-code">

```python
import datetime

# get the account records with `record_date` within 1 year of `account_application_date`
application_date = account['account_application_date'].iat[0]
account_perf_within_1_year = account_performance[
    (application_date < account_performance['record_date']) &
    (account_performance['record_date'] - application_date < datetime.timedelta(days=365))
]

# drop the records that don't have a charge-off amount
account_perf_with_co_amt = account_perf_within_1_year.dropna(subset=['charge_off_amount'])

if account_perf_with_co_amt.empty:
    return 0
if account_perf_with_co_amt['charge_off_amount'].sum() > 0:
    return 1
else:
    return 0
```

</div>

**Example 3: Total deposit amount in the 90 days before application**

*Inputs:*

- **Source Tables**: `application_table`, `application_cashflow_transactions`
- **Source Columns**: `application_table.loan_applied_date`, `application_cashflow_transactions.transaction_date`, `.amount`, `.transaction_type`

Entity is Application, so both DataFrames are sliced to one application's rows. The platform hands your code DataFrames that look like this:

```text
# `application_table`:
#    loan_applied_date
# 0         2025-04-01

# `application_cashflow_transactions`:
#     transaction_date  amount  transaction_type
# 0         2025-01-15     200            credit
# 1         2025-02-20     500             debit
# 2         2025-03-10     300            credit
```

Then your aggregation runs on top of it:

<div class="collapse-code">

```python
import pandas as pd

loan_applied_date = pd.Timestamp(application_table['loan_applied_date'].iat[0])
window_start = loan_applied_date - pd.Timedelta(days=90)

txns = application_cashflow_transactions
deposits_in_window = txns[
    (txns['transaction_type'] == 'credit')
    & (txns['transaction_date'] >= window_start)
    & (txns['transaction_date'] < loan_applied_date)
]

if deposits_in_window.empty:
    return 0
return deposits_in_window['amount'].sum()
```
</div>

  </TabItem>
  <TabItem label="Spark">

<figure>
  <img src="/images/how-tos/register-a-data-aggregate/register-a-data-aggregate-06-spark-definition.png" alt="Definition editor with Spark selected, showing a groupBy aggregation and the Output Dataframe Key field below the editor." class="screenshot" loading="lazy" />
  <figcaption>Spark Input Type exposes each table as an ungrouped DataFrame across all entities. The Output Dataframe Key field sits below the editor.</figcaption>
</figure>

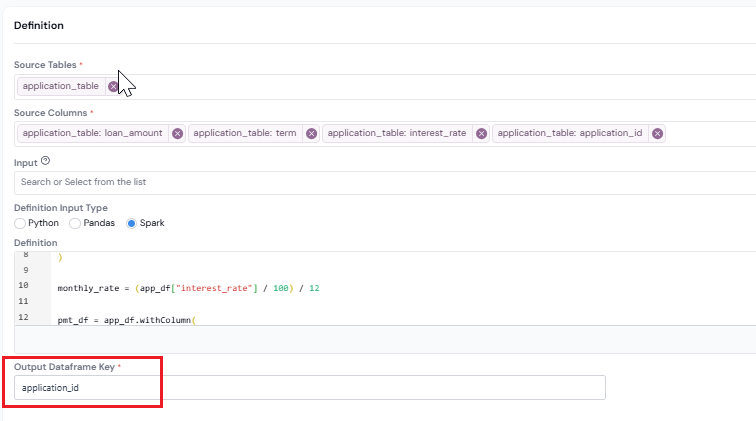
When you select **Spark** as the Input Type, each source table is exposed as a **Spark DataFrame** containing the full, ungrouped table across every entity. You do the `groupBy` yourself in code, and the return value must be a 2-column DataFrame: the entity key (for example, `customer_id`) and the aggregated value.

:::caution[Spark constraints]
- **SELECT only.** Use `SELECT` queries on the input tables. `CREATE`, `INSERT`, `DROP`, and similar mutations are not allowed.
- **No external data reads.** Do not read from outside sources with `spark.read.csv`, `spark.read.parquet`, or similar. Use only the tables provided as inputs.
- **Self-contained logic.** Each Data Element's code must run on its own. Do not depend on intermediate state from another Data Element.
- **No cross-Data-Element UDFs or temp views.** UDFs and temp views registered in one Data Element must not be used in another.
:::

**Example 1: Total number of accounts for customer**

*Inputs:*

- **Source Tables**: `customer_to_account`
- **Source Columns**: `customer_id`, `account_id`

Spark hands you the full table across every customer:

```text
# `customer_to_account`:
+-----------+----------+
|customer_id|account_id|
+-----------+----------+
|         42|       101|
|         42|       102|
|         42|       103|
|         43|       201|
|         43|       202|
+-----------+----------+
```

Then your aggregation runs on top of it, doing the `groupBy` yourself:

```python
import pyspark.sql.functions as F

# `customer_to_account` is a Spark DataFrame
return customer_to_account.groupBy('customer_id').agg(
    F.countDistinct('account_id')
)
```

**Example 2: Default in the next 12 months of application**

*Inputs:*

- **Source Tables**: `account`, `account_performance`
- **Source Columns**: `account.account_id`, `account.application_date`, `account_performance.account_id`, `account_performance.record_date`, `account_performance.COAMT`

Both tables arrive ungrouped, with the join key included so you can stitch them together. The platform hands your code DataFrames that look like this:

```text
# `account`:
+----------+----------------+
|account_id|application_date|
+----------+----------------+
|       101|      2024-01-15|
|       201|      2024-02-10|
+----------+----------------+

# `account_performance`:
+----------+-----------+-----+
|account_id|record_date|COAMT|
+----------+-----------+-----+
|       101| 2024-04-01| null|
|       101| 2024-08-15|  500|
|       201| 2024-05-20| null|
+----------+-----------+-----+
```

Then your aggregation runs on top of it:

<div class="collapse-code">

```python
import pyspark.sql.functions as F
from pyspark.sql.functions import udf
from pyspark.sql.types import IntegerType

acc_perf = account_performance.select(
    'account_id', 'record_date', 'COAMT'
).join(
    account.select('account_id', 'application_date'),
    on='account_id', how='left',
)

CO1yr_df = acc_perf.filter(
    acc_perf.record_date < F.date_add(acc_perf['application_date'], 365)
)
COAMT_df = (
    CO1yr_df.groupBy('account_id')
    .agg(F.sum('COAMT'))
    .toDF('account_id', 'COAMT')
)

def charge_off(x):
    return 1 if x > 0 else 0

charge_off_flag_udf = udf(lambda s: charge_off(s), IntegerType())

COAMT_df = COAMT_df.withColumn(
    'charge_off_flag', charge_off_flag_udf('COAMT')
)

return COAMT_df.select('account_id', 'charge_off_flag')
```

</div>

**Example 3: Total deposit amount in the 90 days before application**

*Inputs:*

- **Source Tables**: `application_table`, `application_cashflow_transactions`
- **Source Columns**: `application_table.application_id`, `application_table.loan_applied_date`, `application_cashflow_transactions.application_id`, `.transaction_date`, `.amount`, `.transaction_type`

Full unfiltered tables across all applications. The platform hands your code DataFrames that look like this:

```text
# `application_table`:
+--------------+-----------------+
|application_id|loan_applied_date|
+--------------+-----------------+
|          A001|       2025-04-01|
|          A002|       2025-04-05|
+--------------+-----------------+

# `application_cashflow_transactions`:
+--------------+----------------+------+----------------+
|application_id|transaction_date|amount|transaction_type|
+--------------+----------------+------+----------------+
|          A001|      2025-01-15|   200|          CREDIT|
|          A001|      2025-02-20|   500|           DEBIT|
|          A001|      2025-03-10|   300|          CREDIT|
|          A002|      2025-02-25|   400|          CREDIT|
+--------------+----------------+------+----------------+
```

Then your aggregation runs on top of it. Join on `application_id`, filter, then aggregate back to one row per application:

<div class="collapse-code">

```python
import pyspark.sql.functions as F

txns = application_cashflow_transactions.join(
    application_table.select('application_id', 'loan_applied_date'),
    on='application_id', how='left',
)

deposits_in_window = txns.filter(
    (F.col('transaction_type') == 'CREDIT')
    & (F.to_date('transaction_date') >= F.date_sub(F.col('loan_applied_date'), 90))
    & (F.to_date('transaction_date') < F.col('loan_applied_date'))
)

return deposits_in_window.groupBy('application_id').agg(
    F.sum('amount').alias('total_deposits_last_90d')
)
```

</div>

:::note[Set the Output Dataframe Key]
Spark adds an extra **Output Dataframe Key** field below the editor. Enter the name of the entity key column in your returned DataFrame (for example, `customer_id`, `account_id`, or `application_id`). The platform uses this to join the aggregation result back to the parent entity.
:::
<figure>
  <img src="/images/how-tos/register-a-data-aggregate/register-a-data-aggregate-07-output-dataframe-key.png" alt="Output Dataframe Key field with the entity key column name entered." class="screenshot" loading="lazy" />
  <figcaption>Enter the exact name of the entity key column in the DataFrame your code returns.</figcaption>
</figure>

  </TabItem>
</Tabs>
</div>

</details>

<details open class="step">
<summary>

#### Fill in Properties and Create

</summary>

Fill in the [Properties](/user-guide/how-tos/common-registration-info/#properties) (Description, Permissible Purpose, Group, and Keywords), then click **Create** at the bottom right. The Data Element is saved as a draft and you land on its details page.

</details>

## What's Next

Once registered, the Data Aggregate can be used across [Features](/user-guide/how-tos/register-a-feature/), [Models](/user-guide/how-tos/register-a-model-definition/), and [Policies](/user-guide/how-tos/register-policy-decision-workflow/) just like any other Data Element. You can also [run a simulation](/user-guide/how-tos/run-a-simulation/) on it (with reports for summary statistics, distributions, and percentage of missing values) and trace its lineage to every downstream object.

Next steps:

- Build a [Feature](/user-guide/how-tos/register-a-feature/) on top of this Data Aggregate.
- Send it for [approval](/user-guide/how-tos/approve-an-object/) so it can be used outside your draft workspace.
- Need a value that reads straight from one column (like `annual_income`)? Register a simple [Data Element](/user-guide/how-tos/register-a-data-element/) instead.
