---
title: "Run a Simulation"
description: "Run a simulation to execute an object's logic across a sample as a queued job."
---
TL;DR
A simulation runs a registered object's logic over your data. Open any object, click Run → Simulation, and fill in Sampling to pick which records to run on. Click Run Job. Everything else has a default, so add Reports or other settings only if you need them.
## What is it?
A simulation executes the logic of a registered object - a data element, feature, model, or policy you have built and saved on the platform - on data. It is the primary way to test your work, validate performance, and produce the results you'll attach when you request approval.
For example, say you've built a new credit risk model and want to see how it scores last quarter's applications before you request approval. The simulation runs the model over those records and gives you the job output plus any reports you pick.
Simulations can be run at any point. You do not need to wait for approval to test your work.
## Launching a Simulation
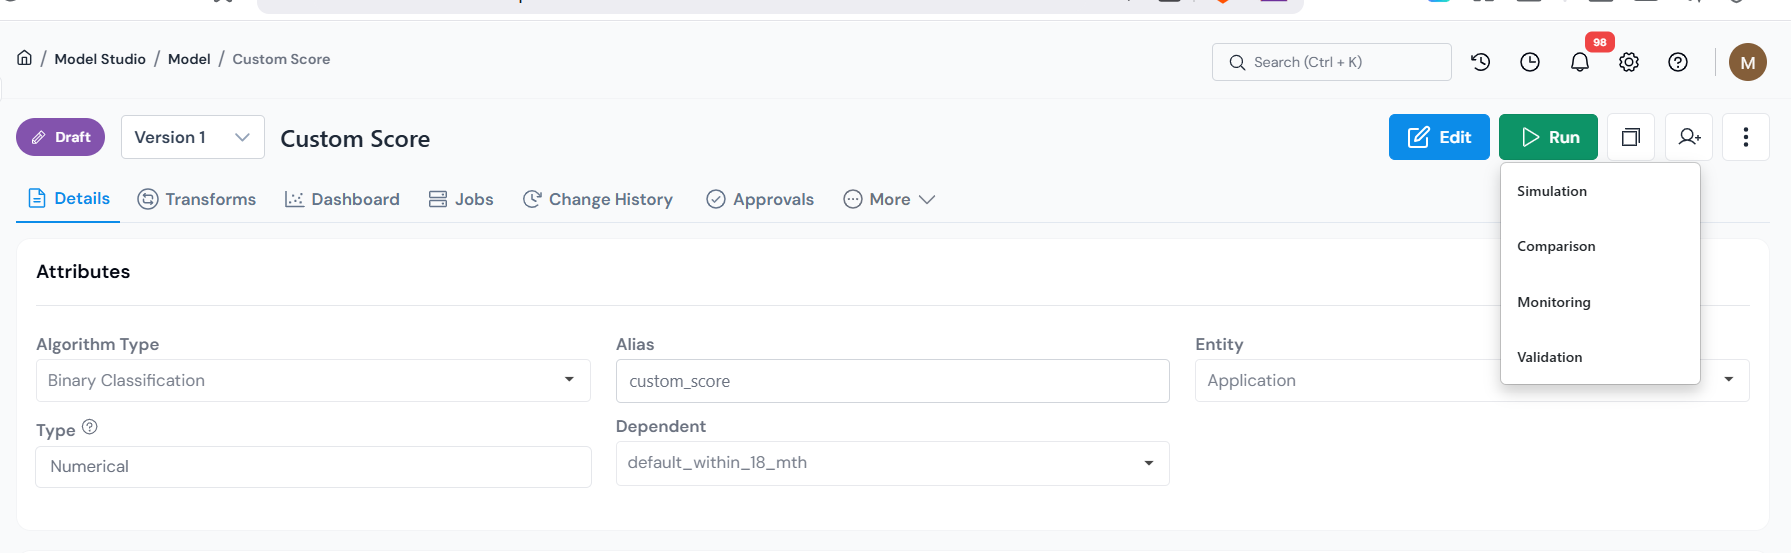
1. Navigate to the object you want to simulate in **Data Vault**, **Feature Engineering**, **Model Studio**, or a **Policy** module, and open its registry page.
2. Click **Run** in the top right corner.
3. Select **Simulation** from the dropdown.
Open any registered object and choose Run → Simulation to launch the job form.
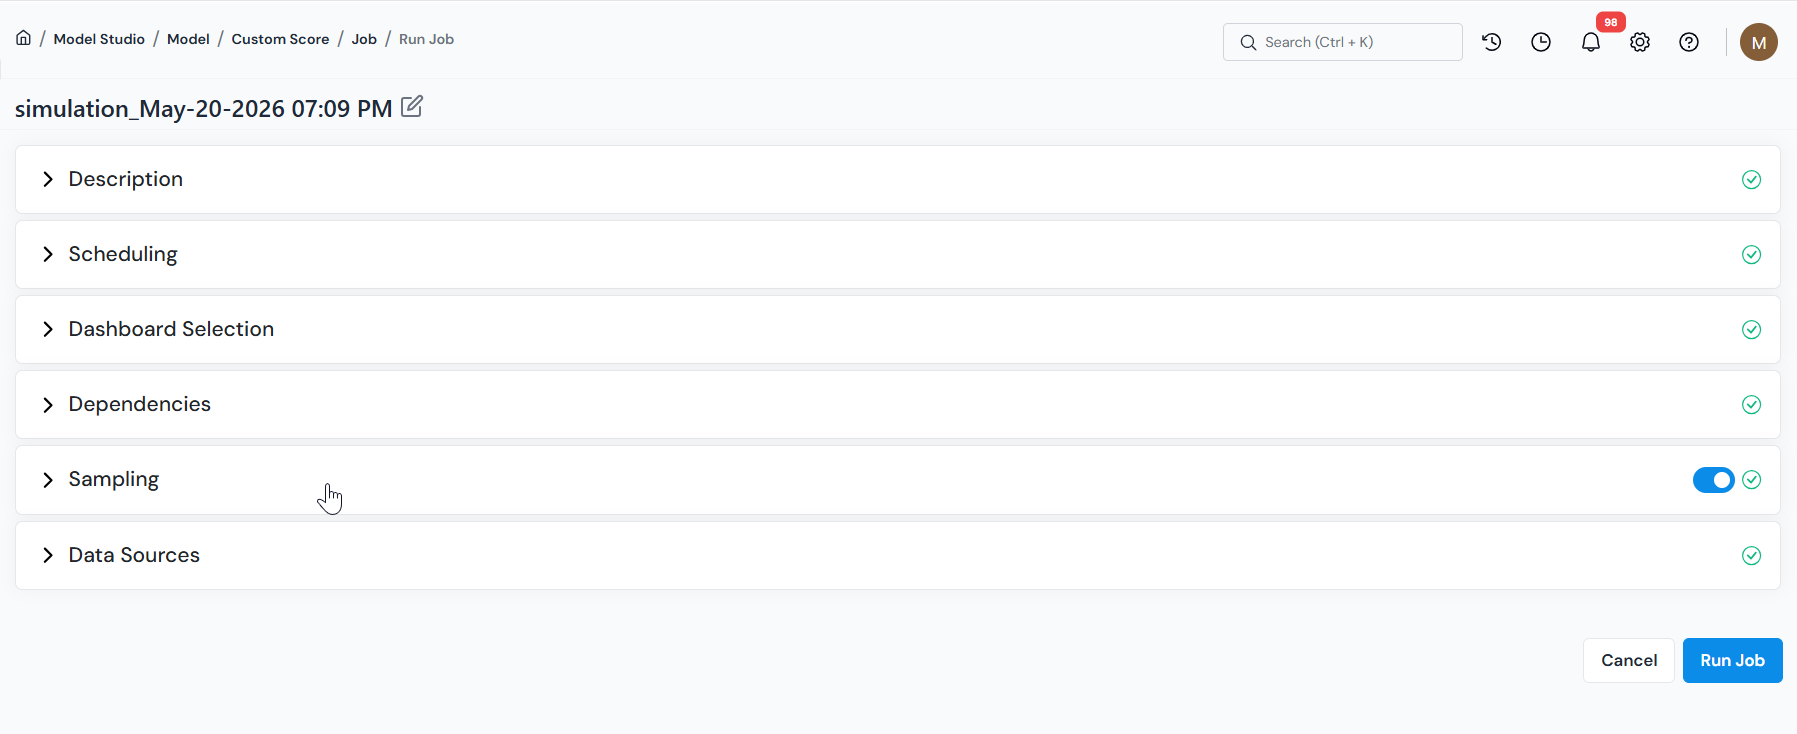
This opens the simulation job form. Fill only the sections your run needs, starting with the one most runs use.
The job form is a single scrollable page; each section can be filled independently.
## Running a Simulation
You can click **Run Job** as soon as the form opens. With nothing changed, the object runs over its entire registered population.
Usually you don't want everything, though. You want last quarter's applications, or one product's accounts, or a specific list of IDs. That's what **Sampling** is for, and it's the one section most people set before running.
1. In the job form, open **Sampling**. Use the toggle on the right of the section header to turn sampling on or off; with it off, the object runs over the full population. With it on, pick one of the two modes below to choose which records to run on.
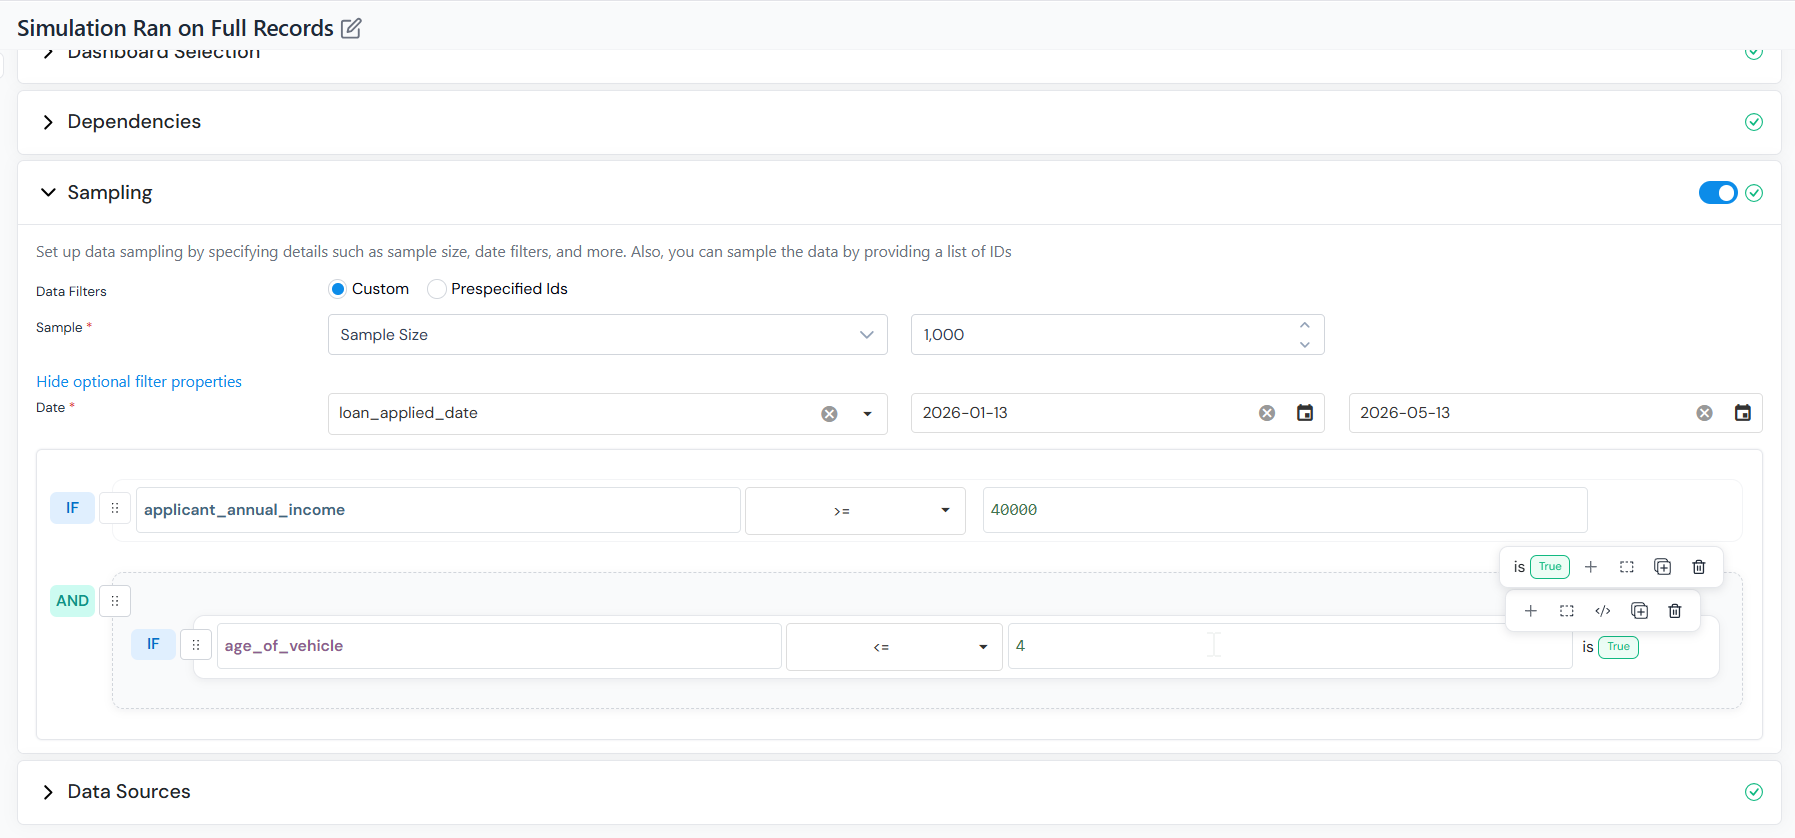
The platform selects records for you by size, date range, and rules.
* **Sample** - select **Sample Size** (fixed row count), **Sample Ratio** (percentage of the table), or **Full** (entire population), then enter the value.
* **Date** (optional) - expand **Show optional filter properties** and choose a date column to filter the population by a time window. When a date column is selected, enter the **From** and **To** values for the window.
* **Additional rules** (optional) - click **Add additional rules** to add expression filters (for example, `FICO >= 680`).
In Custom mode, set the sample size or ratio and optionally add date or expression filters.
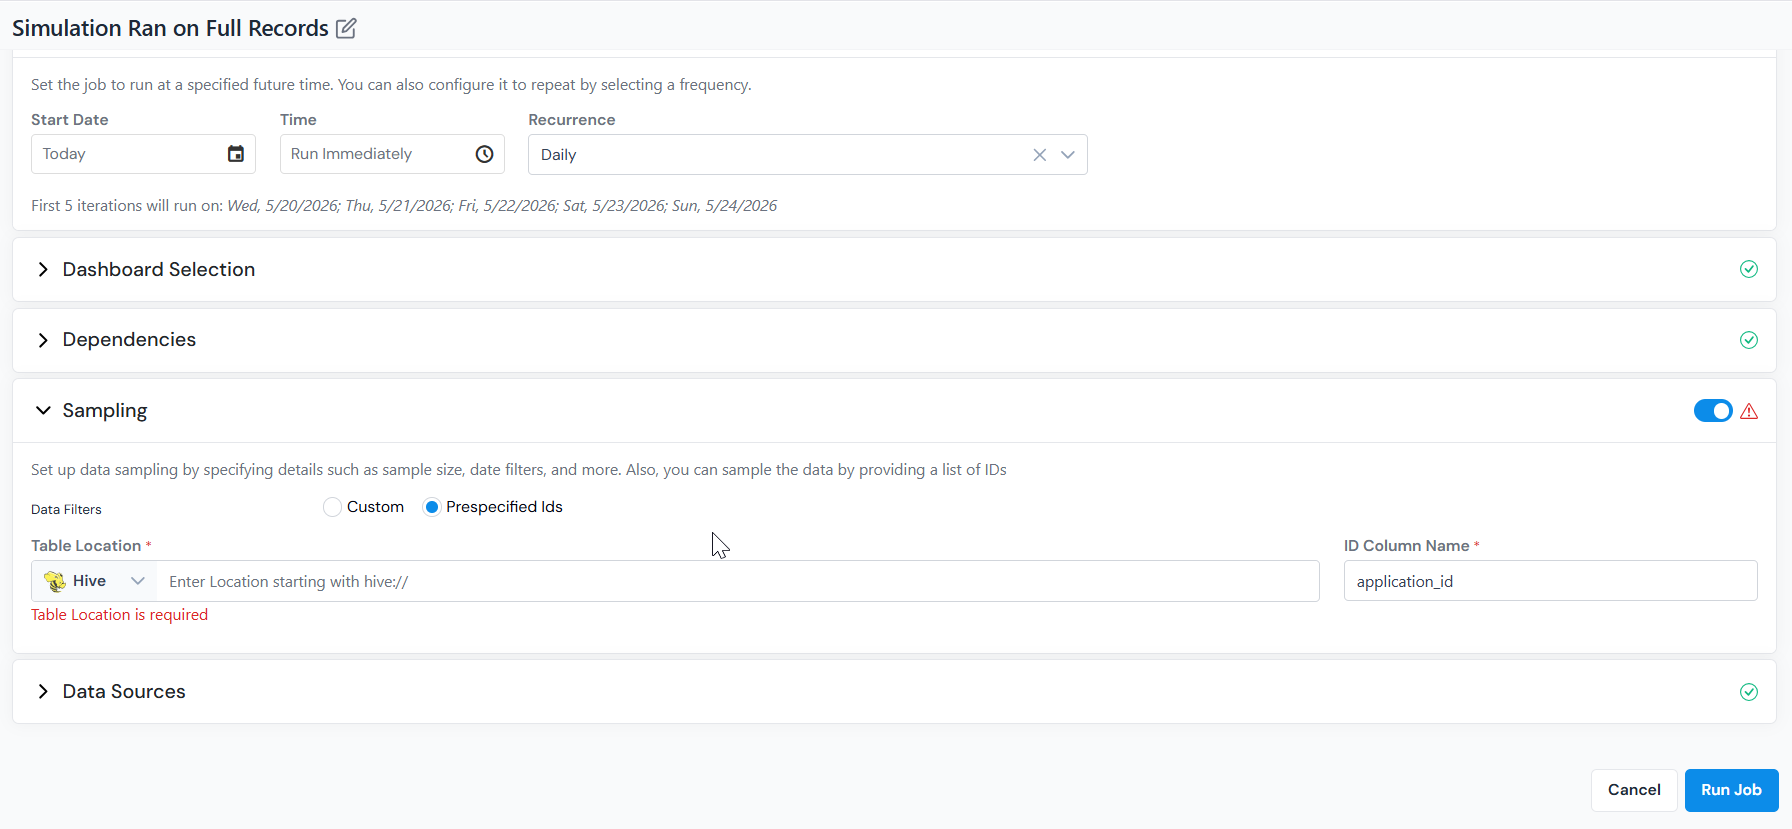
You already have the account IDs or application IDs you want to score; provide them and the simulation runs on exactly those. Point to a table or upload a CSV/Excel file containing your list of IDs.
* **Table Location** - a path on any supported source (Hive, S3, GCP, HDFS), or upload a CSV/Excel file from your local drive.
* **ID Column Name** - the column containing the IDs. Defaults to the entity column of the object; override if your file uses a different name.
In Prespecified Ids mode, point to a table or upload a file containing the exact record IDs to score.
2. Click **Run Job** at the bottom of the form.
3. You are redirected to the **Jobs** tab, where you can monitor progress.
To add reports or read from a different source, see the sections below before clicking **Run Job**.
## Add Reports
If you only need the scored records, skip this section. Add reports when you also want performance metrics and charts, KS, lift, ROC curves, or approval rates on top of job output.
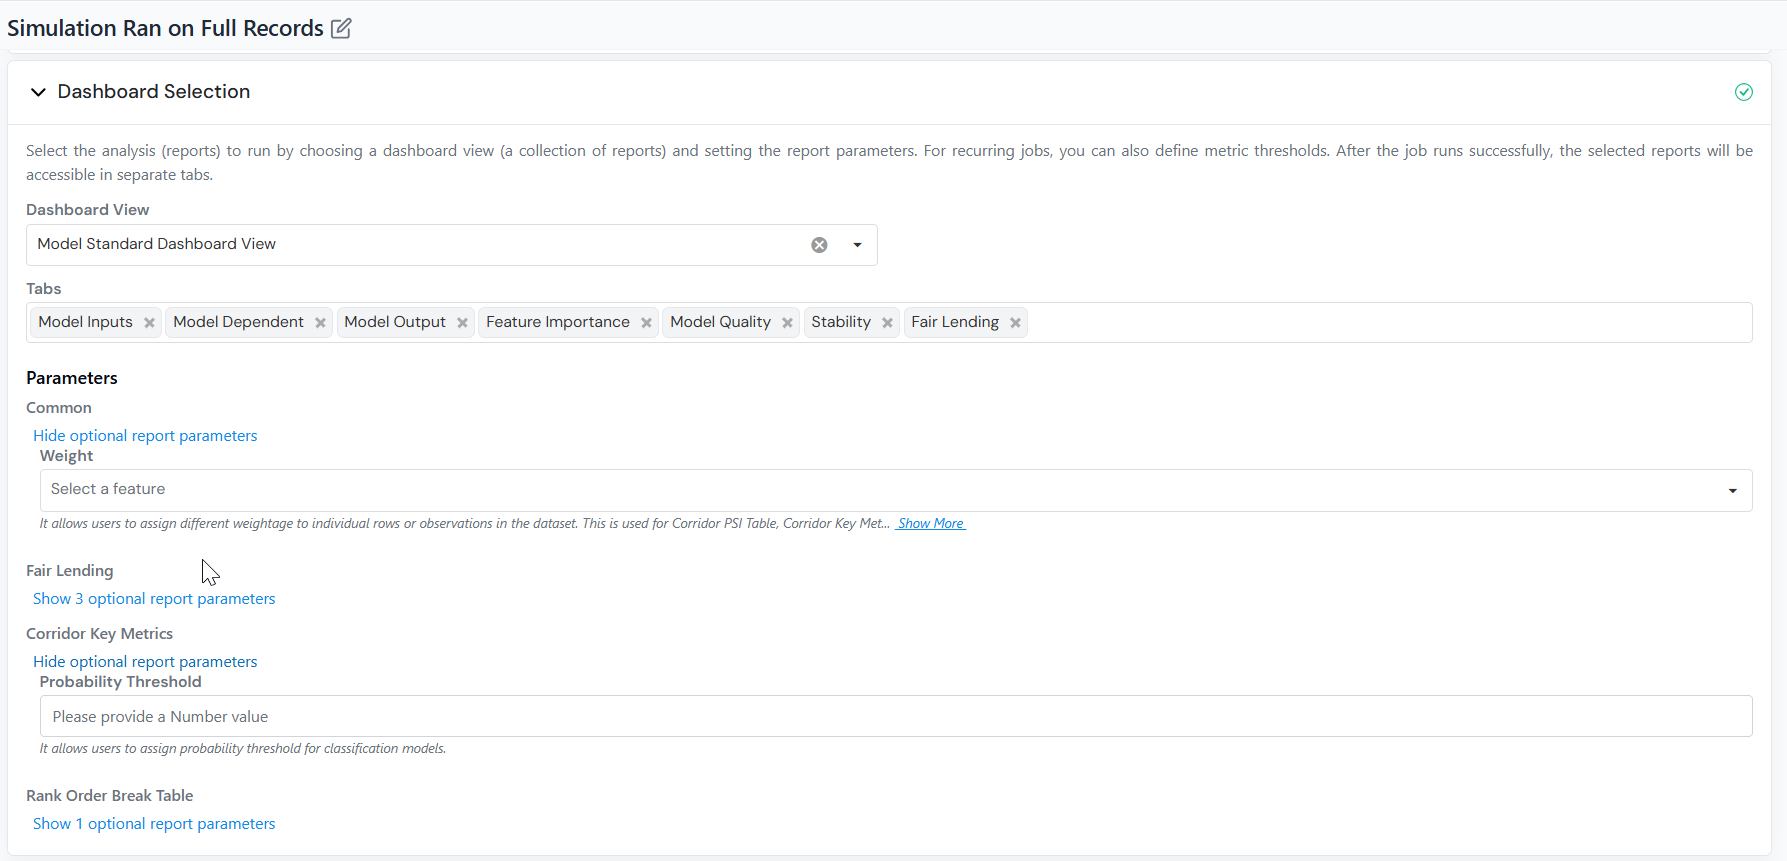
* Choose one or more **Reports** to run. Each selected report renders as its own tab in the results.
* Under **Parameters**, expand each report group and supply the value for each input the report needs (for example, *weight* for a weighted-average report, or *threshold* for a flagging report).
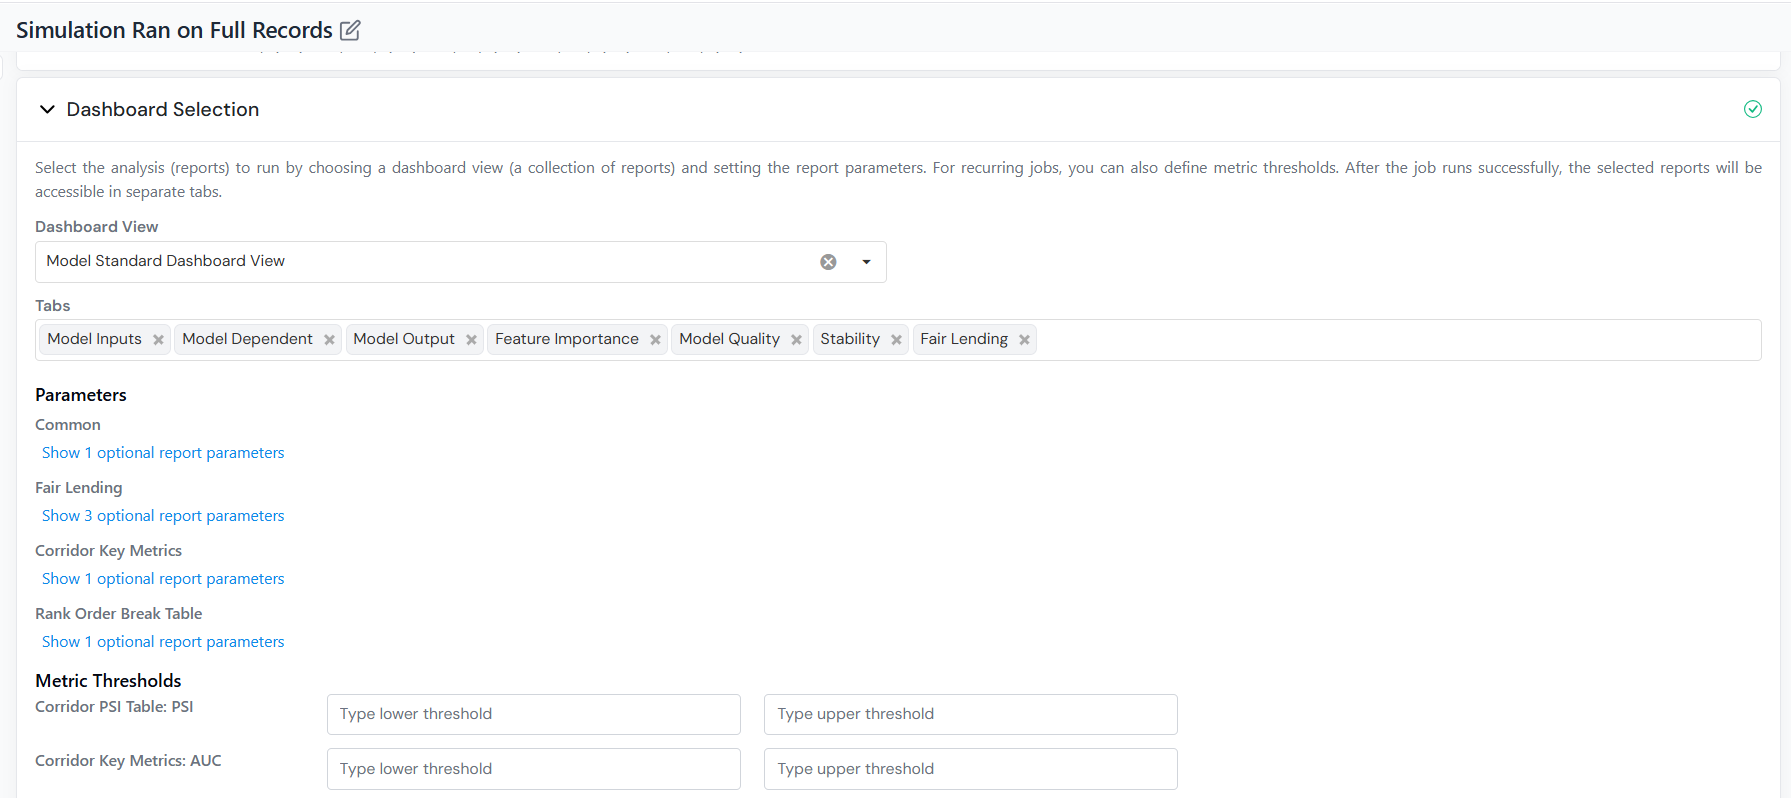
* For scheduled jobs, if the selected report tracks a metric over time, set **upper and lower thresholds** to flag values that breach those limits in the Tracking Report.
Select the reports to run and expand each report group to supply its parameters.On scheduled jobs, set upper and lower thresholds to flag metrics that breach those limits in the Tracking Report.
## Optional Configuration
These sections customize the run. Each has a default, so skip any you do not need.
**Default:** standard execution environment.
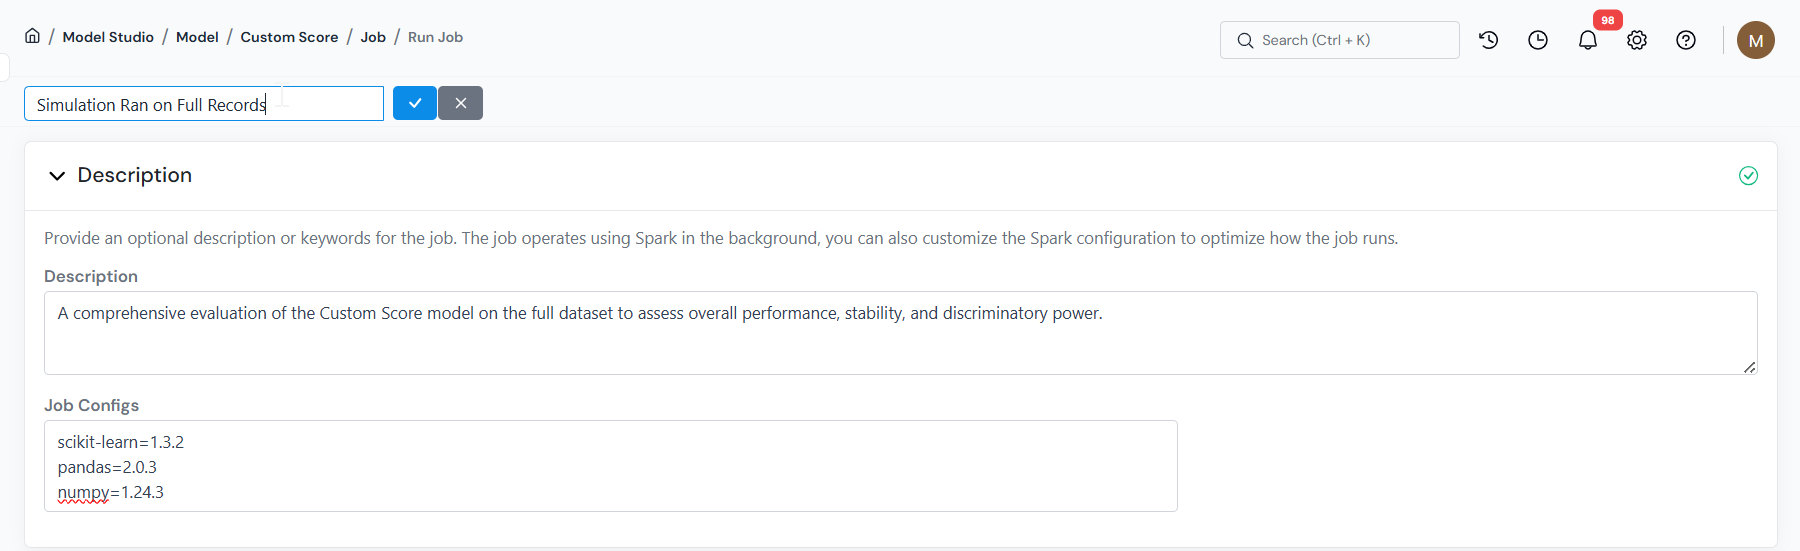
Add a note describing what you are testing, or use **Job Configs** to override Spark settings for this run (for example, `executor memory`, `yarn queue`, or a specific library version such as `scikit-learn=0.24.2`).
Use the Description section to record what you are testing and override Spark settings if needed.
**Default:** runs immediately.
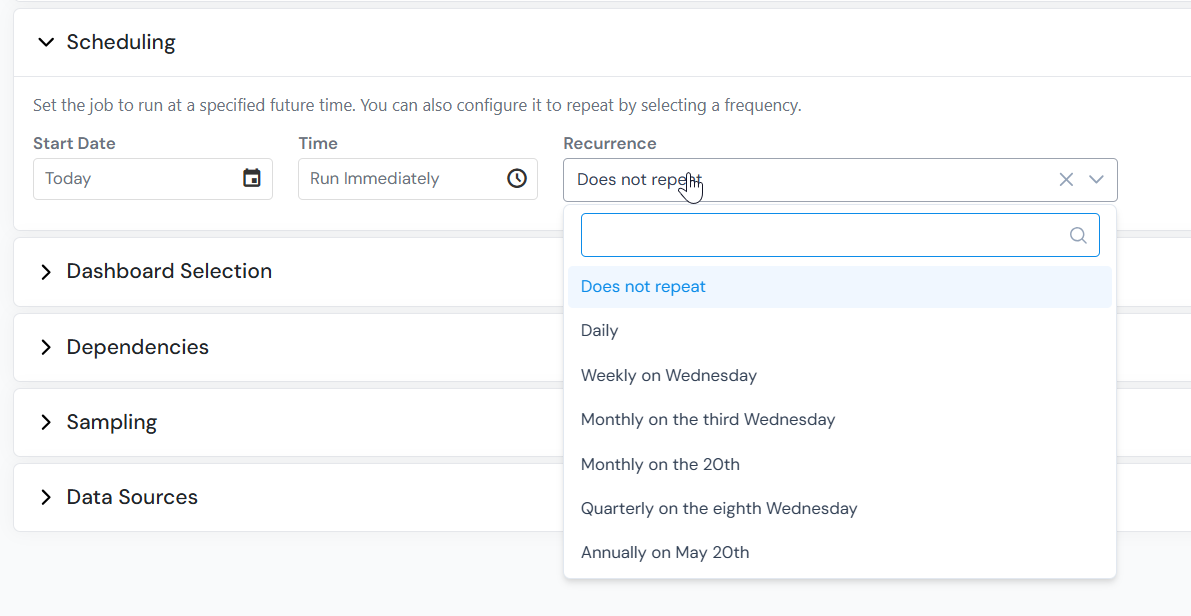
Set a **Start Date** and enable **Recurrence** to schedule repeating runs (daily, weekly, monthly, and so on). Each run is preserved on the **Jobs** tab, so you can compare results across periods or track a metric over time.
Leave the schedule empty to run immediately, or set a Start Date and Recurrence for repeating runs.
Dependencies are inputs the object's logic references that don't come from your data columns: **Global Variables**, **Product Type Configs**, and **Runtime Parameters**. The job can't run until each required one has a value, and those values are **not** prefilled, so you set them here.
For example, a model that reads a `min_fico` **Runtime Parameter** shows a field where you type the cutoff to use for this run (say `680`). A **Global Variable** or **Product Type Config** shows a dropdown where you pick the registered feature that supplies its value.
The section groups them two ways:
* **Current Object** - the dependencies of the object you are simulating.
* **Dependents** - the dependencies of the other objects it relies on, if any.
Fill every required field in both groups before running.
**Default:** reads the input tables from the locations registered in Data Vault.
You only need this section if you want to do one of two things:
* **From data file** - read a table from a different location than the registered one.
* **From existing job** - use a previous job's output as this run's input.
Use the radio button at the top of the section to switch between them.
**From data file**
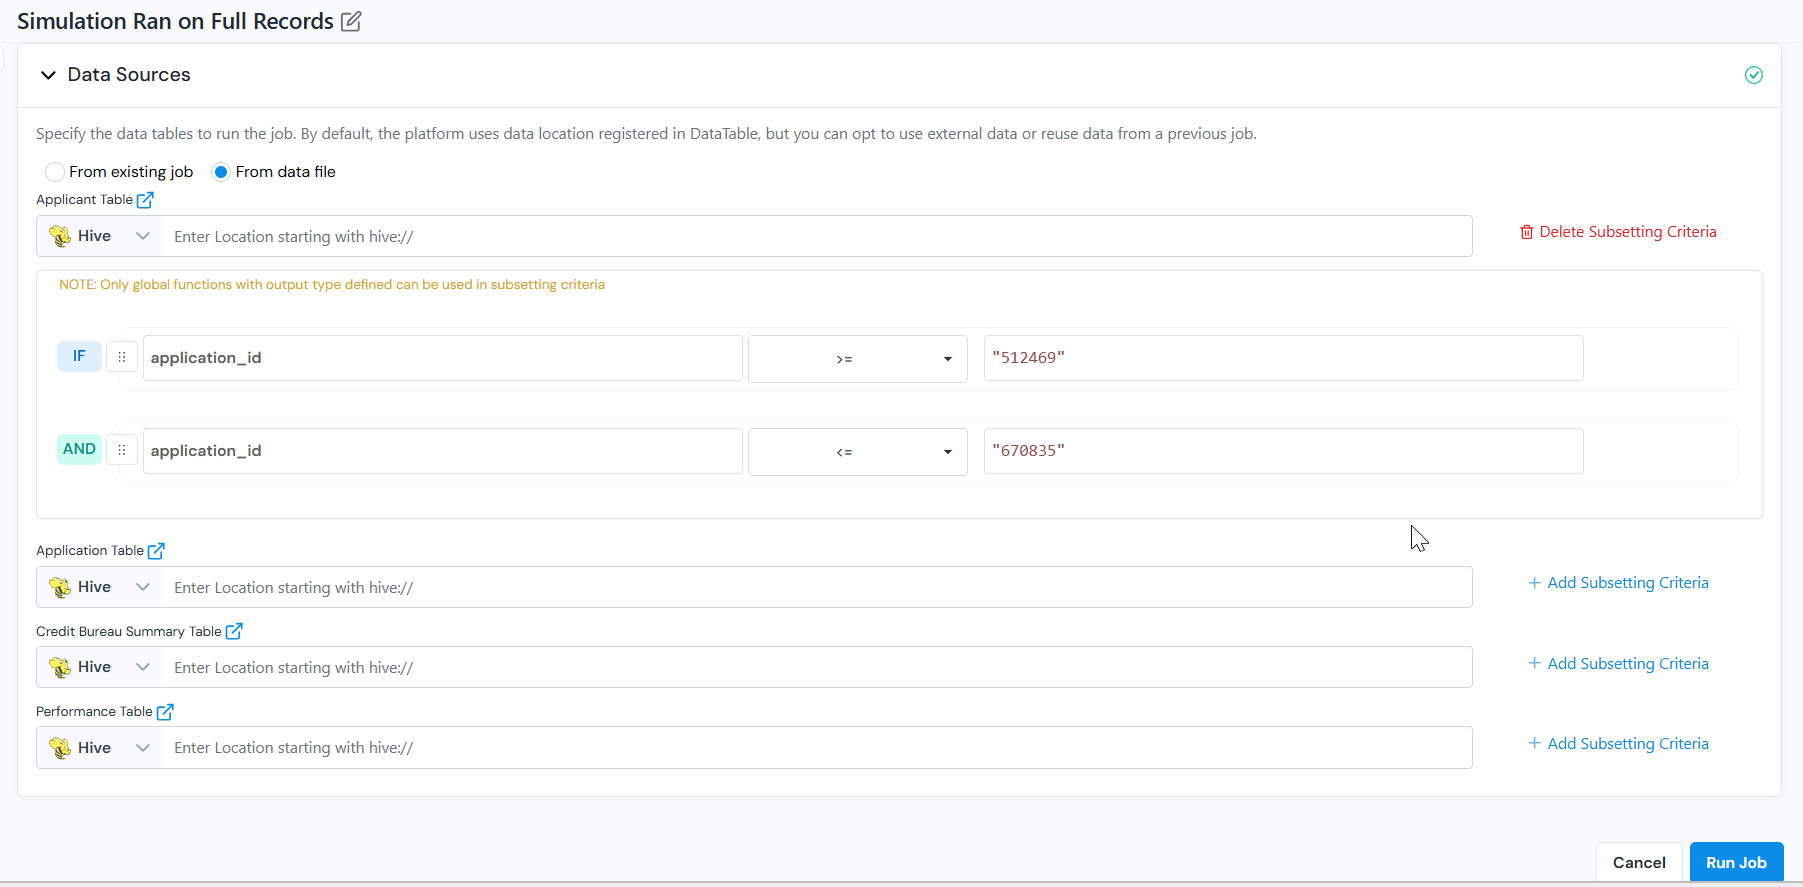
Override the registered location for one or more input tables (for example, *Applicant Table*, *Application Table*).
* For each table, select the source type (Hive, S3, GCP, HDFS) and enter the location, or upload a CSV/Excel file. Column names and types must match the registered schema.
* Click **Add Subsetting Criteria** next to a table to filter rows before they are read (for example, `application_date >= '2024-01-01'` or `region = 'US'`).
:::tip
Subsetting criteria reduce how much data is read from the data lake and can significantly cut runtime on large tables.
:::
Add subsetting criteria to filter rows before they are read. Table locations default to the registered paths; override them if needed.
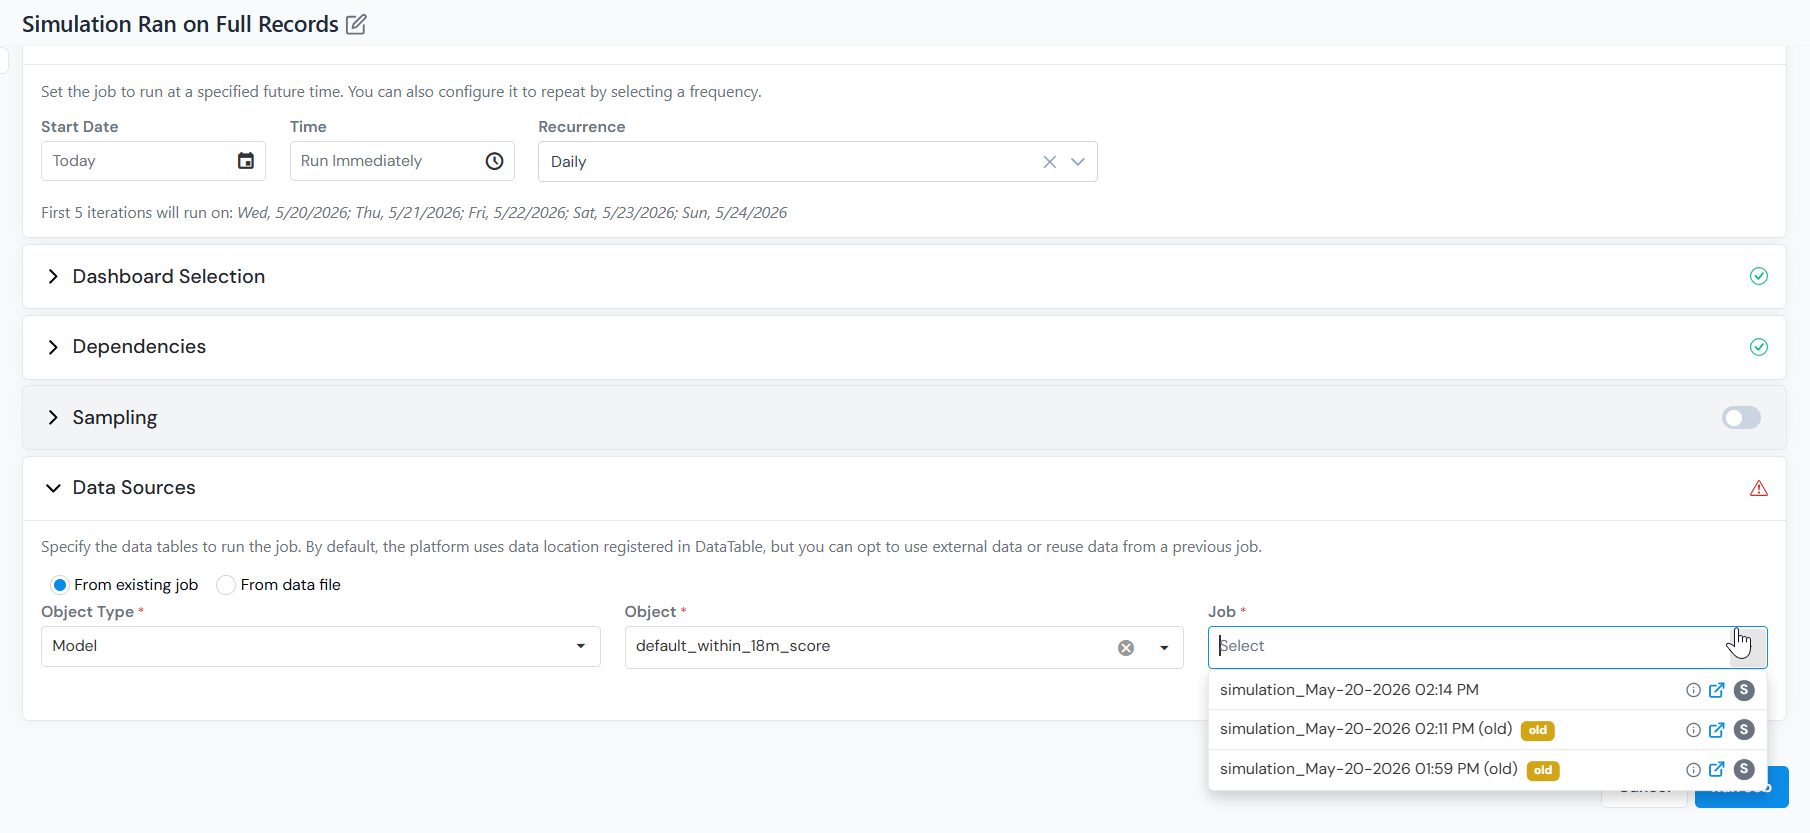
**From existing job**
Reuse the output of a previous job as the input for this one.
:::note
**From existing job** requires sampling to be disabled. The output of a previous job is already a fixed population, so layering sampling on top would be ambiguous.
:::
* Select **Object Type**, **Object**, and then the specific **Job** to reuse.
* The reused job is not limited to the same object type, as long as its output contains the inputs this object needs (for example, a Feature job can feed a Data Element simulation).
Pick a previous job whose output supplies the inputs this simulation needs.
## Submitting and Monitoring the Job
After you click **Run Job**, you land on the **Jobs** tab, which shows the job's current status. Any given job only reaches a subset of these; it will be one of the following.
Status
What it means
Scheduled
Set to run at a later time or on a recurrence; it has not started yet.
Queued
Waiting for resources.
Compiling
Job is being compiled.
Running
Execution is in progress.
Completed
Job finished successfully.
Partially Completed
The job ran, but some records failed to be scored while the rest succeeded. Open the job to see which.
Failed
Execution failed. Download the log from the job details page to see why.
Cancelled
Stopped manually before it finished.
Execution time depends on data size and system load. To watch progress, use the **Job Board** icon () in the top bar to track queue position and progress.
## Reading the Results
Once the simulation completes, open it from the **Jobs** tab. Use the outputs to confirm the object scored the records as expected, review any reports, and catch problems before approval.
Tab
Description
Job Details
Summary of how the job was configured (sample, filters, data source, scheduling, object version). Useful for reproducing the run later.
Job Result
Row-level job output, downloadable as CSV or Parquet, plus runtime breakdown and execution logs.
Report Tabs
One tab per report selected in the Reports step. Whatever reports you chose render here. For a Model, this is where reports like ROC/AUC, KS, lift, confusion matrix, or any custom report you selected appear. For a Policy, it is where segment-level approval rates, risk distributions, or other custom reports you added appear.
## What's next
* [Compare Two Simulations](/user-guide/how-tos/compare-simulations/) side by side to analyze differences in results, metrics, and reports (for example, a candidate model against the production champion, or the same model across two date ranges).
* Read [Understand Job Output](/user-guide/how-tos/understand-job-output/) to make sense of the columns in the Job Result.
* For an in-production model or policy, [Monitor your Model or Policy](/user-guide/how-tos/monitor-model-policy/) using scheduled simulations and metric thresholds.