

Register a Data Aggregate
Ask AI
Compute a value across multiple rows (like “max DPD in the last 6 months”) and register it as an Aggregated Data Element. Tick Is Aggregated on the Data Element form, point at one or more source tables, and write the aggregation in Python, Pandas, or Spark.
What is it?
Section titled “What is it?”An Aggregated Data Element is one whose value is computed across multiple rows rather than read from a single column. Use it when the value you need has to be calculated across records, for example counting an account’s transactions, taking the max DPD over the last 6 months, or rolling Account rows up to a Customer.
| Simple Data Element | Data Aggregate (this page) | |
|---|---|---|
| Maps from | A single column | Multiple rows across one or more tables |
| Use when | The column value is ready to use as-is | You need to compute something across records |
| Example | annual_income from app_table | Max DPD in the last 6 months: the highest days_past_due across the last 6 rows in account_performance |
How to Register
Section titled “How to Register”Follow these steps to register a Data Aggregate.
Open the Create Form
Section titled “Open the Create Form”
Open the Create Form
Section titled “Open the Create Form”On the Data Vault → Data Element page, click + New Data Element.
A name prompt opens first. Enter a descriptive name for the Data Element (for example, Total Deposit Amount (Last 90D)) and confirm to land on the full Data Element form.
Fill in Attributes
Section titled “Fill in Attributes”
Fill in Attributes
Section titled “Fill in Attributes”Set the Data Type * - the output type of your aggregation (for example, numerical for a count or sum, boolean for a flag).
Fill in the Alias and Entity. See Common Registration Info.
Tick Is Aggregated. This switches the Definition section into aggregation mode, revealing an Input Type editor in place of the Source Column dropdown.
Fill in Definition
Section titled “Fill in Definition”
Fill in Definition
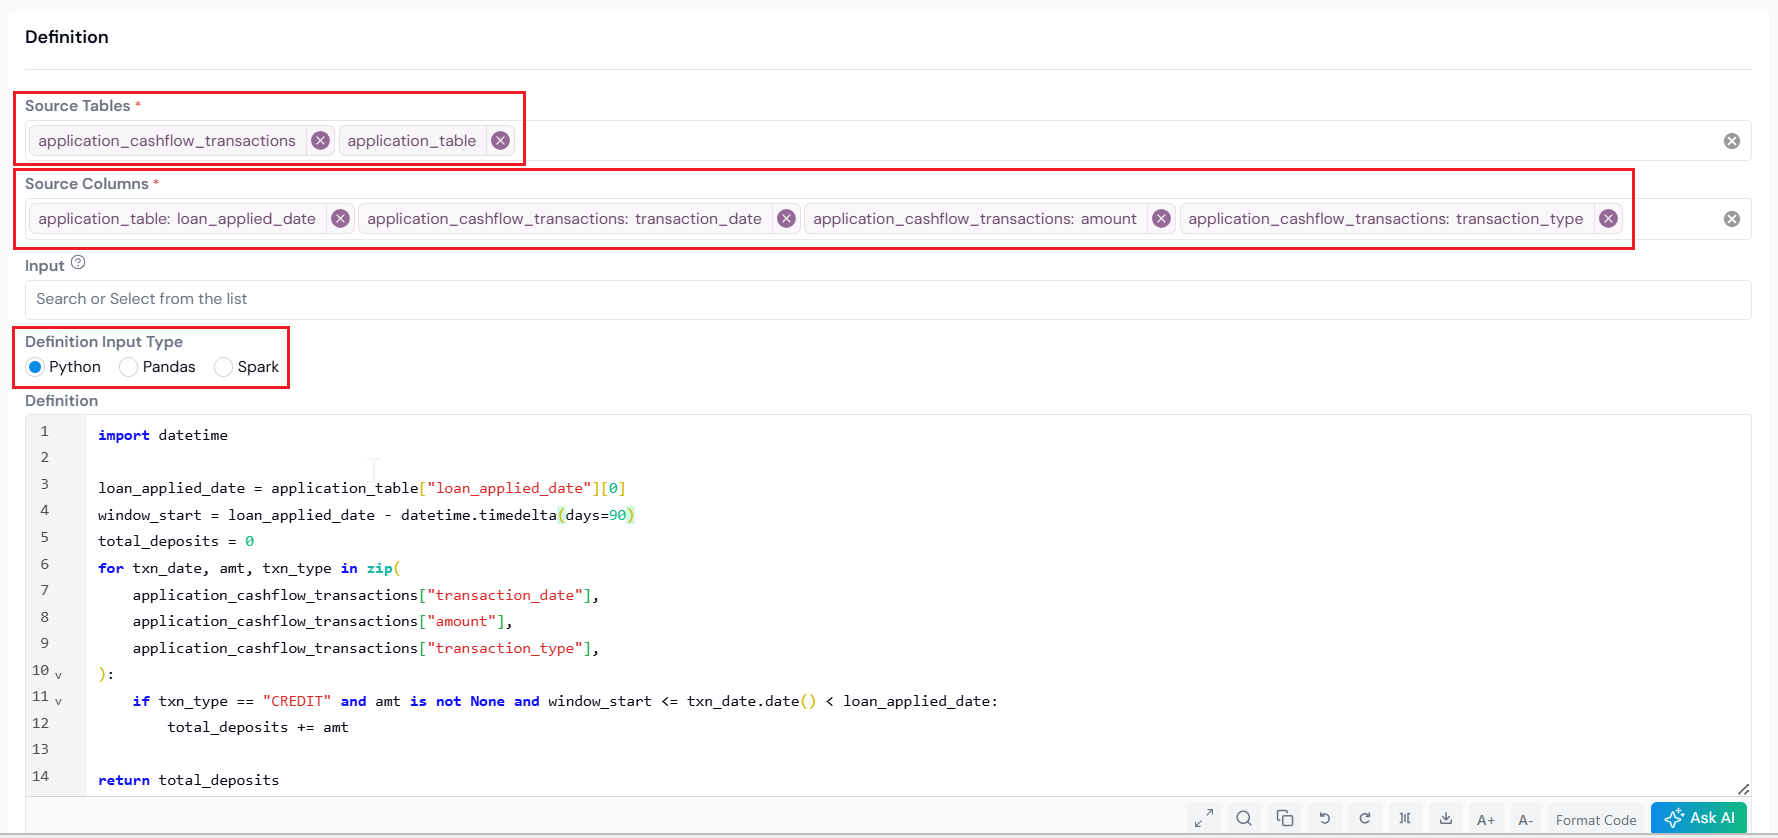
Section titled “Fill in Definition”- Source Tables * - one or more tables linked to the entity. Each chosen table becomes a variable in the editor: a table aliased
accountis referenced asaccountin code. - Source Columns * - the specific columns from those tables that your aggregation reads. Each one is exposed inside the corresponding table variable.
- Input - any reusable global function registered on the platform that the aggregation should call.
- Input Type - pick the language used for the aggregation (Python, Pandas, or Spark), then write the logic in the editor below.
How the platform groups your data
Section titled “How the platform groups your data”When you set Entity to Customer, and pick account (an Account-level table) as the source, Account rolls up to Customer. The platform groups Account rows by Customer before handing them to your code. Python and Pandas receive the data already filtered to one customer’s rows, so you write logic for a single entity. Spark receives the full source table and you must do the groupBy('customer_id') yourself, returning a DataFrame keyed by the entity.
Pick the input language that fits how you want to work with the data:
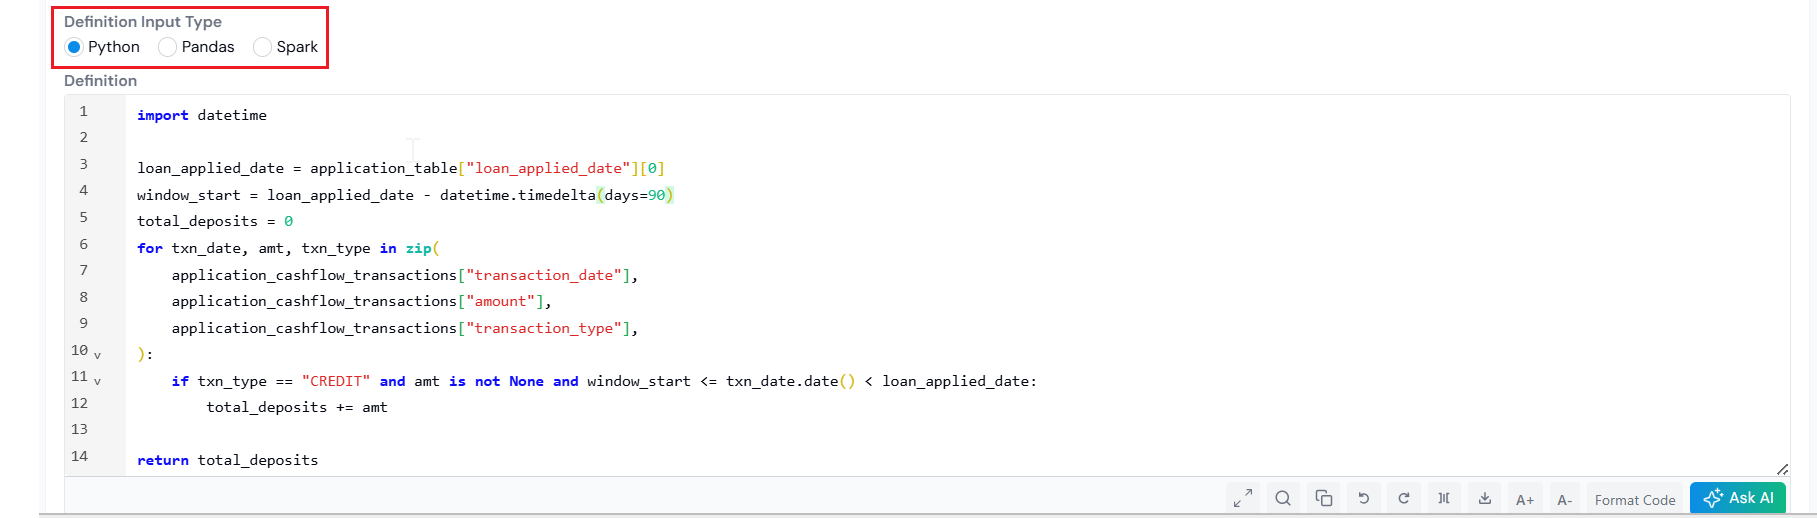
When you select Python as the Input Type, each source table is exposed as a dictionary of lists, sliced to the rows belonging to the current entity. Each column lookup returns a Python list. You can import standard libraries (numpy, math, datetime, etc.) inside the editor.
Example 1: Total number of accounts for customer
Inputs:
- Source Tables:
account - Source Columns:
account_id
Only account_id is selected, so that is the only key available inside account. The platform hands your code a dictionary that looks like this:
account = { 'account_id': [101, 102, 103],}Then your aggregation runs on top of it:
# `account` is a data dictionaryreturn len(set(account['account_id']))Example 2: Default in the next 12 months of application
Inputs:
- Source Tables:
account,account_performance - Source Columns:
account.account_application_date,account_performance.record_date,account_performance.charge_off_amount
Each table is its own dictionary, with one key per selected column. The platform hands your code the data sliced to one application’s rows:
account = { 'account_application_date': ['2024-01-15'],}account_performance = { 'record_date': ['2024-04-01', '2024-08-15', '2025-03-01'], 'charge_off_amount': [None, 500, None],}Then your aggregation runs on top of it:
import datetime
# sum charge_off_amount for records within 1 year of `account_application_date`application_date = account['account_application_date'][0]total_charge_off_amount = 0for date, co_amt in zip(    account_performance['record_date'],    account_performance['charge_off_amount'],):    if (        date >= application_date        and date - application_date < datetime.timedelta(days=365)        and co_amt    ):        total_charge_off_amount += co_amt
# default flag if total_charge_off_amount > 0if not total_charge_off_amount:    return 0elif total_charge_off_amount > 0:    return 1else:    return 0
Example 3: Total deposit amount in the 90 days before application
Inputs:
- Source Tables:
application_table,application_cashflow_transactions - Source Columns:
application_table.loan_applied_date,application_cashflow_transactions.transaction_date,.amount,.transaction_type
The Entity here is Application, so both dictionaries are sliced to one application’s rows. The platform hands your code the data like this:
application_table = { 'loan_applied_date': ['2025-04-01'],}application_cashflow_transactions = { 'transaction_date': ['2025-01-15', '2025-02-20', '2025-03-10'], 'amount': [200, 500, 300], 'transaction_type': ['CREDIT', 'DEBIT', 'CREDIT'],}Then your aggregation runs on top of it:
import datetime
loan_applied_date = application_table["loan_applied_date"][0]window_start = loan_applied_date - datetime.timedelta(days=90)total_deposits = 0for txn_date, amt, txn_type in zip(    application_cashflow_transactions["transaction_date"],    application_cashflow_transactions["amount"],    application_cashflow_transactions["transaction_type"],):    if (        txn_type == "CREDIT"        and amt is not None        and window_start <= txn_date.date() < loan_applied_date    ):        total_deposits += amt
return total_deposits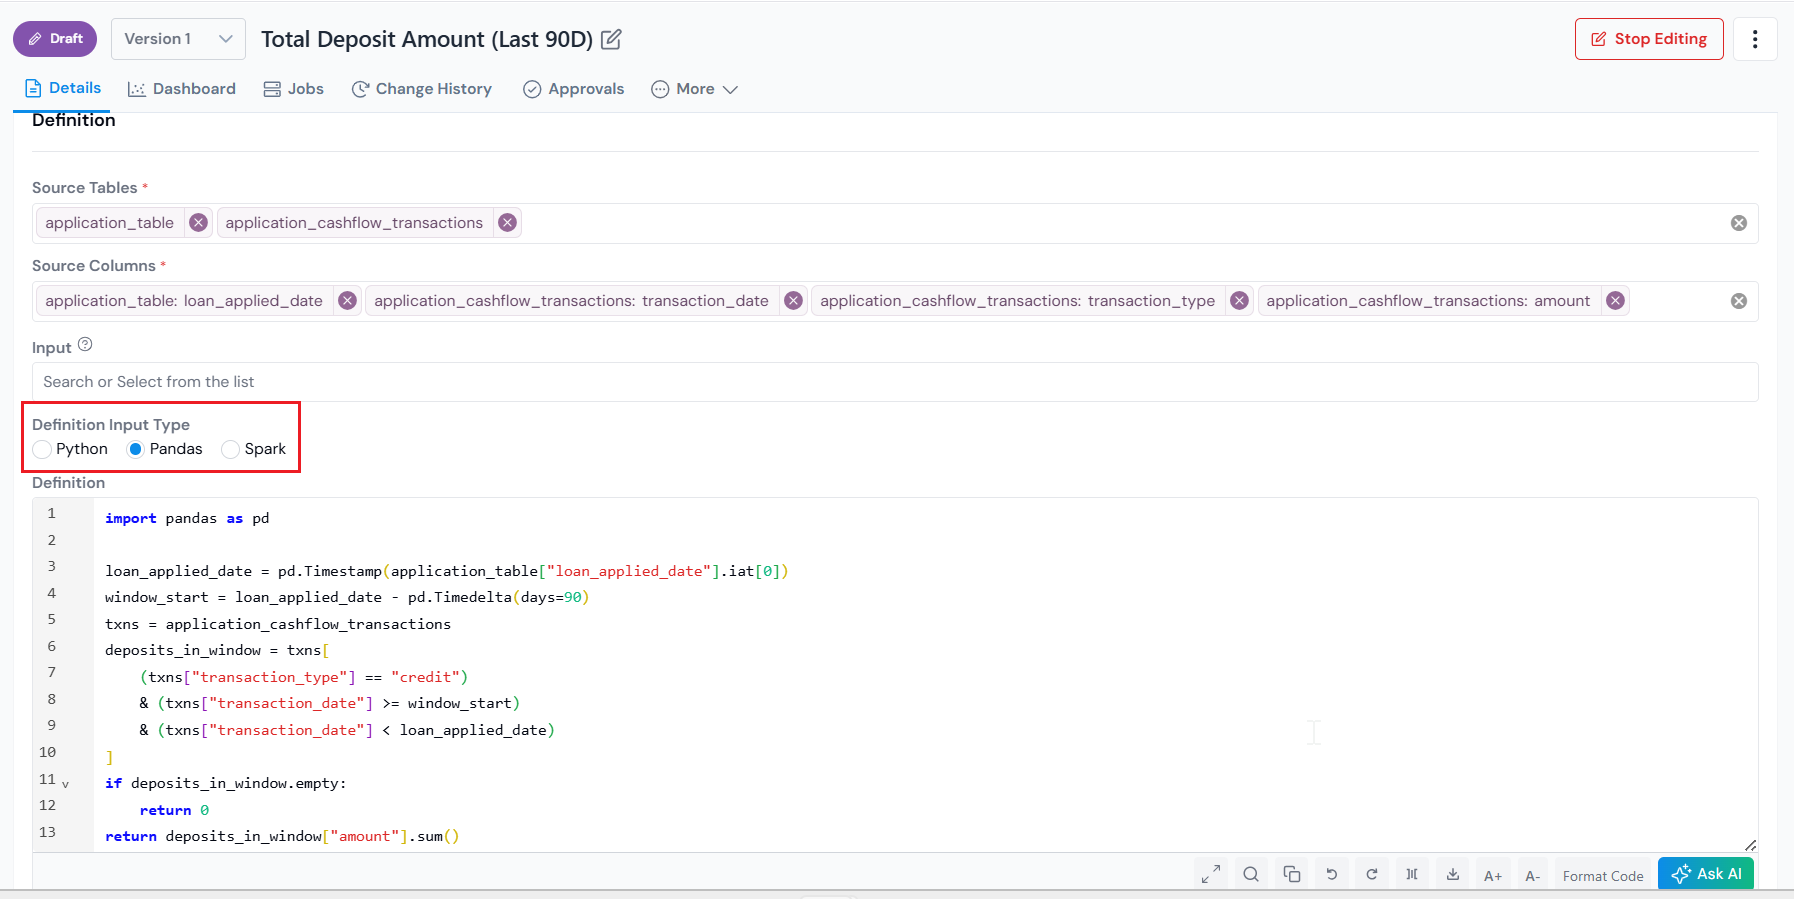
When you select Pandas as the Input Type, each source table is exposed as a pandas DataFrame, sliced to the rows belonging to the current entity.
Example 1: Total number of accounts for customer
Inputs:
- Source Tables:
account - Source Columns:
account_id
Only account_id is selected, so account is a single-column DataFrame. The platform hands your code a DataFrame that looks like this:
# `account`:# account_id# 0 101# 1 102# 2 103Then your aggregation runs on top of it:
# `account` is a pandas DataFramereturn account['account_id'].nunique()Example 2: Default in the next 12 months of application
Inputs:
- Source Tables:
account,account_performance - Source Columns:
account.account_application_date,account_performance.record_date,account_performance.charge_off_amount
Each table becomes its own DataFrame, holding only the selected columns and only the rows for the current customer. The platform hands your code DataFrames that look like this:
# `account`:#    account_application_date# 0               2024-01-15
# `account_performance`:#    record_date  charge_off_amount# 0   2024-04-01                NaN# 1   2024-08-15              500.0# 2   2025-03-01                NaN
Then your aggregation runs on top of it:
import datetime
# get the account records with `record_date` within 1 year of `account_application_date`application_date = account['account_application_date'].iat[0]account_perf_within_1_year = account_performance[    (application_date < account_performance['record_date']) &    (account_performance['record_date'] - application_date < datetime.timedelta(days=365))]
# drop the records that don't have a charge-off amountaccount_perf_with_co_amt = account_perf_within_1_year.dropna(subset=['charge_off_amount'])
if account_perf_with_co_amt.empty:    return 0if account_perf_with_co_amt['charge_off_amount'].sum() > 0:    return 1else:    return 0
Example 3: Total deposit amount in the 90 days before application
Inputs:
- Source Tables:
application_table,application_cashflow_transactions - Source Columns:
application_table.loan_applied_date,application_cashflow_transactions.transaction_date,.amount,.transaction_type
Entity is Application, so both DataFrames are sliced to one application’s rows. The platform hands your code DataFrames that look like this:
# `application_table`:#    loan_applied_date# 0         2025-04-01
# `application_cashflow_transactions`:#     transaction_date  amount  transaction_type# 0         2025-01-15     200            credit# 1         2025-02-20     500             debit# 2         2025-03-10     300            credit
Then your aggregation runs on top of it:
import pandas as pd
loan_applied_date = pd.Timestamp(application_table['loan_applied_date'].iat[0])window_start = loan_applied_date - pd.Timedelta(days=90)
txns = application_cashflow_transactionsdeposits_in_window = txns[    (txns['transaction_type'] == 'credit')    & (txns['transaction_date'] >= window_start)    & (txns['transaction_date'] < loan_applied_date)]
if deposits_in_window.empty:    return 0return deposits_in_window['amount'].sum()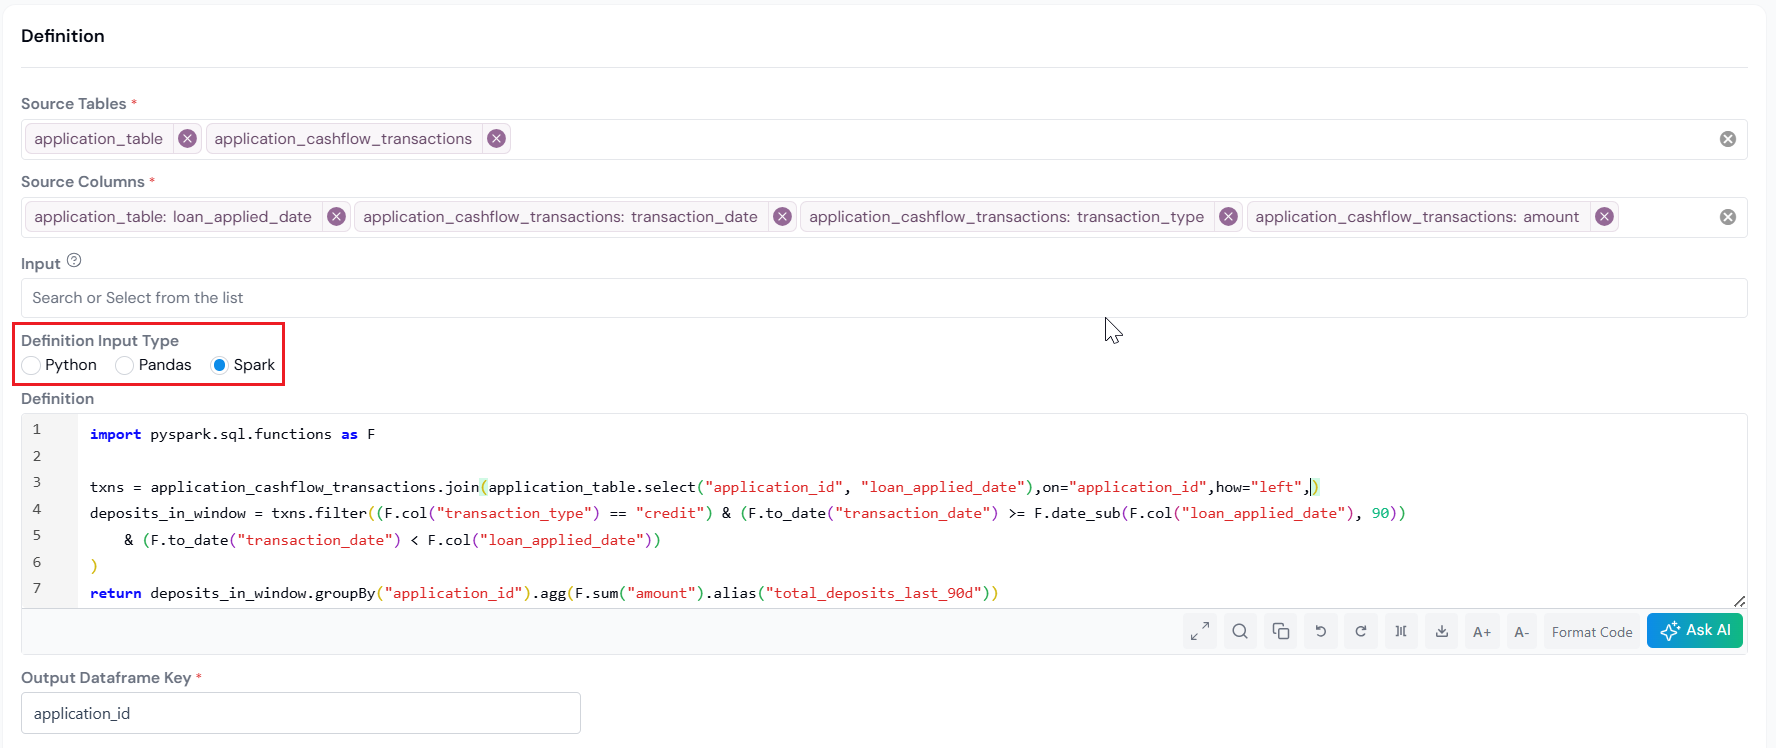
When you select Spark as the Input Type, each source table is exposed as a Spark DataFrame containing the full, ungrouped table across every entity. You do the groupBy yourself in code, and the return value must be a 2-column DataFrame: the entity key (for example, customer_id) and the aggregated value.
Example 1: Total number of accounts for customer
Inputs:
- Source Tables:
customer_to_account - Source Columns:
customer_id,account_id
Spark hands you the full table across every customer:
# `customer_to_account`:+-----------+----------+|customer_id|account_id|+-----------+----------+| 42| 101|| 42| 102|| 42| 103|| 43| 201|| 43| 202|+-----------+----------+Then your aggregation runs on top of it, doing the groupBy yourself:
import pyspark.sql.functions as F
# `customer_to_account` is a Spark DataFramereturn customer_to_account.groupBy('customer_id').agg(    F.countDistinct('account_id'))
Example 2: Default in the next 12 months of application
Inputs:
- Source Tables:
account,account_performance - Source Columns:
account.account_id,account.application_date,account_performance.account_id,account_performance.record_date,account_performance.COAMT
Both tables arrive ungrouped, with the join key included so you can stitch them together. The platform hands your code DataFrames that look like this:
# `account`:+----------+----------------+|account_id|application_date|+----------+----------------+|       101|      2024-01-15||       201|      2024-02-10|+----------+----------------+
# `account_performance`:+----------+-----------+-----+|account_id|record_date|COAMT|+----------+-----------+-----+|       101| 2024-04-01| null||       101| 2024-08-15|  500||       201| 2024-05-20| null|+----------+-----------+-----+
Then your aggregation runs on top of it:
import pyspark.sql.functions as Ffrom pyspark.sql.functions import udffrom pyspark.sql.types import IntegerType
acc_perf = account_performance.select(    'account_id', 'record_date', 'COAMT').join(    account.select('account_id', 'application_date'),    on='account_id', how='left',)
CO1yr_df = acc_perf.filter(    acc_perf.record_date < F.date_add(acc_perf['application_date'], 365))COAMT_df = (    CO1yr_df.groupBy('account_id')    .agg(F.sum('COAMT'))    .toDF('account_id', 'COAMT'))
def charge_off(x):    return 1 if x > 0 else 0
charge_off_flag_udf = udf(lambda s: charge_off(s), IntegerType())
COAMT_df = COAMT_df.withColumn(    'charge_off_flag', charge_off_flag_udf('COAMT'))
return COAMT_df.select('account_id', 'charge_off_flag')
Example 3: Total deposit amount in the 90 days before application
Inputs:
- Source Tables:
application_table,application_cashflow_transactions - Source Columns:
application_table.application_id,application_table.loan_applied_date,application_cashflow_transactions.application_id,.transaction_date,.amount,.transaction_type
Full unfiltered tables across all applications. The platform hands your code DataFrames that look like this:
# `application_table`:+--------------+-----------------+|application_id|loan_applied_date|+--------------+-----------------+|          A001|       2025-04-01||          A002|       2025-04-05|+--------------+-----------------+
# `application_cashflow_transactions`:+--------------+----------------+------+----------------+|application_id|transaction_date|amount|transaction_type|+--------------+----------------+------+----------------+|          A001|      2025-01-15|   200|          CREDIT||          A001|      2025-02-20|   500|           DEBIT||          A001|      2025-03-10|   300|          CREDIT||          A002|      2025-02-25|   400|          CREDIT|+--------------+----------------+------+----------------+
Then your aggregation runs on top of it. Join on application_id, filter, then aggregate back to one row per application:
import pyspark.sql.functions as F
txns = application_cashflow_transactions.join(    application_table.select('application_id', 'loan_applied_date'),    on='application_id', how='left',)
deposits_in_window = txns.filter(    (F.col('transaction_type') == 'CREDIT')    & (F.to_date('transaction_date') >= F.date_sub(F.col('loan_applied_date'), 90))    & (F.to_date('transaction_date') < F.col('loan_applied_date')))
return deposits_in_window.groupBy('application_id').agg(    F.sum('amount').alias('total_deposits_last_90d'))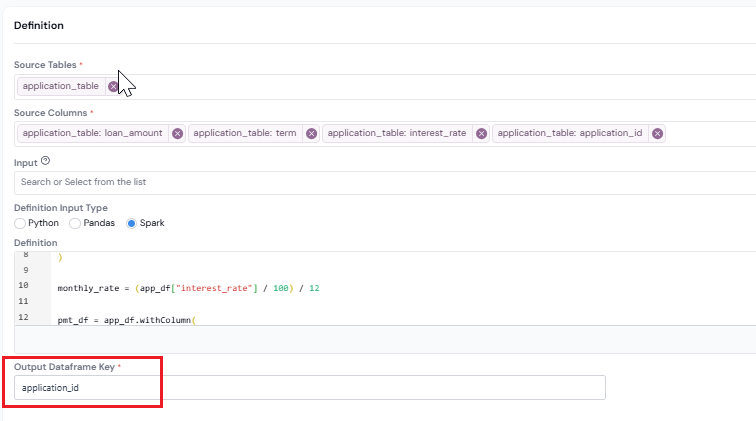
Fill in Properties and Create
Section titled “Fill in Properties and Create”
Fill in Properties and Create
Section titled “Fill in Properties and Create”Fill in the Properties (Description, Permissible Purpose, Group, and Keywords), then click Create at the bottom right. The Data Element is saved as a draft and you land on its details page.
What’s Next
Section titled “What’s Next”Once registered, the Data Aggregate can be used across Features, Models, and Policies just like any other Data Element. You can also run a simulation on it (with reports for summary statistics, distributions, and percentage of missing values) and trace its lineage to every downstream object.
Next steps:
- Build a Feature on top of this Data Aggregate.
- Send it for approval so it can be used outside your draft workspace.
- Need a value that reads straight from one column (like
annual_income)? Register a simple Data Element instead.
Was this page helpful?
Thanks for the feedback.